Aldershot (UK Parliament constituency)
Coordinates: 51°16′26″N 0°45′22″W / 51.274°N 0.756°W
| Aldershot | |
|---|---|
|
Borough constituency for the House of Commons | |
|
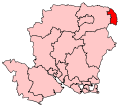
Boundary of Aldershot in Hampshire. | |
|
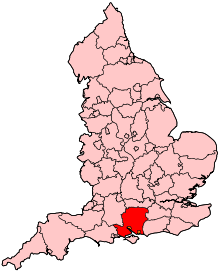
Location of Hampshire within England. | |
| County | Hampshire |
| Population | 103,922 (2011 census)[1] |
| Electorate | 72,430 (December 2015)[2] |
| Major settlements | Aldershot, Farnborough |
| Current constituency | |
| Created | 1918 |
| Member of parliament | Sir Gerald Howarth (Conservative) |
| Number of members | One |
| Overlaps | |
| European Parliament constituency | South East England |
Aldershot /ˈɔːldərˌʃɒt/ is a constituency[n 1] in Hampshire, represented in the House of Commons of the UK Parliament since 1997 by Sir Gerald Howarth of the Conservative Party.[n 2]
Constituency Profile
Aldershot is considered a Conservative safe seat having only elected Conservative MP's since its creation. Since 1974 the Liberal Democrats or its predecessor the Liberals have finished second in every election other than 2015 where Labour were the Conservatives nearest opposition.
The current incumbent Sir Gerald Howarth was MP for Cannock and Burntwood from 1983 till 1992
Boundaries
The constituency is primarily based around the town of Aldershot which is in the north-east of Hampshire, in the borough of Rushmoor. The town of Farnborough is also in the constituency.
Latest boundary review
Following their review of parliamentary representation in Hampshire, the Boundary Commission for England made changes across the county as a consequence of population changes.
The electoral wards, as modified, in the Aldershot constituency are:
- The entire borough of Rushmoor
- Small localities in the district of Hart: Blackwater and Hawley; Frogmore and Darby Green in the Yateley post town
Members of Parliament
| Election | Member[3] | Party | |
|---|---|---|---|
| 1918 | Viscount Wolmer | Conservative
| |
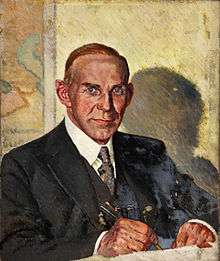
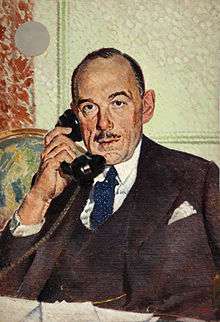
| 1940 by-election | Oliver Lyttelton | Conservative
| |
| 1954 by-election | Sir Eric Errington | Conservative | |
| 1970 | Sir Julian Critchley | Conservative | |
| 1997 | Sir Gerald Howarth | Conservative
| |
Elections
Elections in the 2010s
| Party | Candidate | Votes | % | ± | |
|---|---|---|---|---|---|
| Conservative | Gerald Howarth | 23,369 | 50.6 | +3.9 | |
| Labour | Gary Puffett | 8,468 | 18.3 | +6.2 | |
| UKIP | Bill Walker | 8,253 | 17.9 | +13.4 | |
| Liberal Democrat | Alan Hilliar | 4,076 | 8.8 | -25.6 | |
| Green | Carl Hewitt | 2,025 | 4.4 | N/A | |
| Majority | 14,901 | 32.3 | +20.0 | ||
| Turnout | 46,191 | 63.8 | +0.3 | ||
| Conservative hold | Swing | −1.2 | |||
| Party | Candidate | Votes | % | ± | |
|---|---|---|---|---|---|
| Conservative | Gerald Howarth | 21,203 | 46.7 | +2.7 | |
| Liberal Democrat | Adrian Paul Collett | 15,617 | 34.4 | +5.5 | |
| Labour | Jonathan Slater | 5,489 | 12.1 | −9.6 | |
| UKIP | Robert Snare | 2,041 | 4.5 | +2.1 | |
| English Independence Party | Gary Cowd | 999 | 1.8 | N/A | |
| Christian | Juliana Brimicombe | 231 | 0.5 | N/A | |
| Majority | 5,586 | 12.3 | |||
| Turnout | 45,384 | 63.5 | −0.1 | ||
| Conservative hold | Swing | −1.4 | |||
Elections in the 2000s
| Party | Candidate | Votes | % | ± | |
|---|---|---|---|---|---|
| Conservative | Gerald Howarth | 20,572 | 42.7 | +0.5 | |
| Liberal Democrat | Adrian Paul Collett | 15,238 | 31.7 | +4.1 | |
| Labour | Howard Linsley | 9,895 | 20.6 | −4.6 | |
| UKIP | Derek Leonard Rumsey | 1,182 | 2.5 | +0.7 | |
| English Democrat | Gary Cowd | 701 | 1.5 | N/A | |
| Monster Raving Loony | Howling Laud Hope | 553 | 1.1 | +0.2 | |
| Majority | 5,334 | 11.1 | |||
| Turnout | 48,141 | 61.3 | +3.4 | ||
| Conservative hold | Swing | −1.8 | |||
| Party | Candidate | Votes | % | ± | |
|---|---|---|---|---|---|
| Conservative | Gerald Howarth | 19,106 | 42.2 | −0.5 | |
| Liberal Democrat | Adrian Paul Collett | 12,512 | 27.6 | −2.8 | |
| Labour | Luke Akehurst | 11,394 | 25.2 | +1.0 | |
| UKIP | Derek Leonard Rumsey | 797 | 1.8 | +0.3 | |
| Green | Adam Julian Stacey | 630 | 1.4 | N/A | |
| Independent | Arthur Uther Pendragon | 459 | 1.0 | N/A | |
| Monster Raving Loony | Howling Laud Hope | 390 | 0.9 | N/A | |
| Majority | 6,594 | 14.6 | N/A | ||
| Turnout | 45,288 | 57.9 | −12.9 | ||
| Conservative hold | Swing | +0.0 | |||
Elections in the 1990s
| Party | Candidate | Votes | % | ± | |
|---|---|---|---|---|---|
| Conservative | Gerald Howarth | 23,119 | 42.7 | −14.8 | |
| Liberal Democrat | Adrian Paul Collett | 16,498 | 30.5 | +2.9 | |
| Labour | Terence Bridgeman | 13,057 | 24.1 | +10.8 | |
| UKIP | John Howe | 794 | 1.5 | N/A | |
| Independent | Arthur Uther Pendragon | 361 | 0.7 | N/A | |
| BNP | Donald Stevens | 322 | 0.6 | N/A | |
| Majority | 6,621 | 12.2 | |||
| Turnout | 54,153 | 70.8 | |||
| Conservative hold | Swing | −8.9 | |||
| Party | Candidate | Votes | % | ± | |
|---|---|---|---|---|---|
| Conservative | Julian Critchley | 36,974 | 57.5 | −1.5 | |
| Liberal Democrat | Adrian Paul Collett | 17,786 | 27.6 | −1.6 | |
| Labour | John Anthony Smith | 8,552 | 13.3 | +1.5 | |
| Liberal | David H. Robinson | 1,038 | 1.6 | N/A | |
| Majority | 19,188 | 29.8 | +0.1 | ||
| Turnout | 64,350 | 78.7 | +4.7 | ||
| Conservative hold | Swing | +0.0 | |||
Elections in the 1980s
| Party | Candidate | Votes | % | ± | |
|---|---|---|---|---|---|
| Conservative | Julian Critchley | 35,272 | 59.0 | +3.5 | |
| Liberal | Roger Alan Hargreaves | 17,488 | 29.2 | −4.6 | |
| Labour | Ian Howard Pearson | 7,061 | 11.8 | +1.0 | |
| Majority | 17,784 | 29.7 | |||
| Turnout | 59,822 | 74.0 | |||
| Conservative hold | Swing | +4.1 | |||
| Party | Candidate | Votes | % | ± | |
|---|---|---|---|---|---|
| Conservative | Julian Critchley | 31,288 | 55.5 | ||
| Liberal | N. Westbrook | 19,070 | 33.8 | ||
| Labour | A. Crawford | 6,070 | 10.8 | ||
| Majority | 12,218 | 21.7 | |||
| Turnout | 56,425 | 72.72 | |||
| Conservative hold | Swing | +0.0 | |||
Elections in the 1970s
| Party | Candidate | Votes | % | ± | |
|---|---|---|---|---|---|
| Conservative | Julian Critchley | 38,014 | 57.5 | ||
| Liberal | N. Westbrook | 14,438 | 21.4 | ||
| Labour | D. Somerville | 13,698 | 20.7 | ||
| Majority | 23,576 | 35.6 | |||
| Turnout | 66,150 | 76.5 | |||
| Conservative hold | Swing | +0.0 | |||
| Party | Candidate | Votes | % | ± | |
|---|---|---|---|---|---|
| Conservative | Julian Critchley | 26,463 | 45.1 | ||
| Liberal | A. Burton | 16,104 | 27.5 | ||
| Labour | E.P. Sudworth | 14,936 | 25.5 | ||
| National Front | A. Greenslade | 1,120 | 1.9 | ||
| Majority | 10,359 | 17.7 | |||
| Turnout | 58,620 | 72.8 | |||
| Conservative hold | Swing | ||||
| Party | Candidate | Votes | % | ± | |
|---|---|---|---|---|---|
| Conservative | Julian Critchley | 29,401 | 45.4 | ||
| Liberal | G. Floyd | 18,743 | 28.9 | ||
| Labour | W.L.J.T. Card | 15,492 | 23.9 | ||
| National Front | T. Greenslade | 1,148 | 1.77 | ||
| Majority | 10,658 | 16.5 | |||
| Turnout | 64,781 | 81.2 | |||
| Conservative hold | Swing | +0.0 | |||
| Party | Candidate | Votes | % | ± | |
|---|---|---|---|---|---|
| Conservative | Julian Michael Gordon Critchley | 33,447 | 55.83 | ||
| Labour | Roger T Bogg | 18,916 | 31.57 | ||
| Liberal | Philip M Gibbons | 7,551 | 12.6 | ||
| Majority | 14,531 | 24.25 | |||
| Turnout | 59,909 | 70.89 | |||
| Conservative hold | Swing | +0.0 | |||
Elections in the 1960s
| Party | Candidate | Votes | % | ± | |
|---|---|---|---|---|---|
| Conservative | Sir Eric Errington | 25,672 | 48.92 | ||
| Labour | Derrick Harold Silvester | 16,776 | 31.97 | ||
| Liberal | Gerald Edward Owen | 10,025 | 19.11 | ||
| Majority | 8,896 | 16.95 | |||
| Turnout | 52,473 | 75.38 | |||
| Conservative hold | Swing | +0.0 | |||
| Party | Candidate | Votes | % | ± | |
|---|---|---|---|---|---|
| Conservative | Sir Eric Errington | 25,797 | 52.03 | ||
| Labour | Mrs. Elizabeth K Collard | 13,718 | 27.67 | ||
| Liberal | Philip M Gibbons | 10,066 | 20.30 | ||
| Majority | 12,079 | 24.36 | |||
| Turnout | 49,581 | 75.01 | |||
| Conservative hold | Swing | ||||
Elections in the 1950s
| Party | Candidate | Votes | % | ± | |
|---|---|---|---|---|---|
| Conservative | Sir Eric Errington | 25,161 | 58.4 | ||
| Labour | Roy E Brooks | 12,270 | 28.5 | ||
| Liberal | Enid Lakeman | 5,679 | 13.2 | ||
| Majority | 12,891 | 29.9 | |||
| Turnout | 43,110 | 75.9 | |||
| Conservative hold | Swing | ||||
| Party | Candidate | Votes | % | ± | |
|---|---|---|---|---|---|
| Conservative | Sir Eric Errington | 22,701 | 56.7 | ||
| Labour | Julian D Richards | 13,129 | 32.8 | ||
| Liberal | Enid Lakeman | 4,232 | 10.6 | ||
| Majority | 9,572 | 23.9 | |||
| Turnout | 40,062 | 73.9 | |||
| Conservative hold | Swing | ||||
| Party | Candidate | Votes | % | ± | |
|---|---|---|---|---|---|
| Conservative | Sir Eric Errington | 19,108 | 60.1 | ||
| Labour | William Cuthbertson | 12,701 | 39.9 | ||
| Majority | 6,407 | 20.1 | |||
| Turnout | 31,809 | 58.7 | |||
| Conservative hold | Swing | ||||
| Party | Candidate | Votes | % | ± | |
|---|---|---|---|---|---|
| Conservative | Oliver Lyttelton | 24,951 | 60.3 | ||
| Labour | Robert N Hales | 16,402 | 39.7 | ||
| Majority | 8,549 | 20.7 | |||
| Turnout | 41,353 | 77.8 | |||
| Conservative hold | Swing | ||||
| Party | Candidate | Votes | % | ± | |
|---|---|---|---|---|---|
| Conservative | Oliver Lyttelton | 21,238 | 52.2 | ||
| Labour | NF Hidden | 15,066 | 37.0 | ||
| Liberal | John Henry Gooden | 4,355 | 10.7 | ||
| Majority | 6,172 | 15.2 | |||
| Turnout | 40,659 | 79.7 | |||
| Conservative hold | Swing | ||||
Elections in the 1940s
| Party | Candidate | Votes | % | ± | |
|---|---|---|---|---|---|
| Conservative | Oliver Lyttelton | 19,456 | 57.41 | n/a | |
| Common Wealth | Thomas Henry Wintringham | 14,435 | 42.59 | n/a | |
| Majority | 5,021 | 14.82 | n/a | ||
| Turnout | 33,891 | 69.18 | n/a | ||
| Conservative hold | Swing | n/a | |||
| Party | Candidate | Votes | % | ± | |
|---|---|---|---|---|---|
| Conservative | Oliver Lyttelton | unopposed | n/a | n/a | |
| Conservative hold | Swing | n/a | |||
Elections in the 1930s
| Party | Candidate | Votes | % | ± | |
|---|---|---|---|---|---|
| Conservative | Rt Hon. Viscount Wolmer | 17,730 | 73.4 | -11.0 | |
| Independent Progressive | Vernon Gerald Bailey | 6,421 | 26.6 | n/a | |
| Majority | 11,309 | 46.8 | -22.0 | ||
| Turnout | 24,151 | 58.4 | -7.2 | ||
| Conservative hold | Swing | ||||
| Party | Candidate | Votes | % | ± | |
|---|---|---|---|---|---|
| Conservative | Viscount Wolmer | 22,134 | 84.4 | ||
| Labour | Mary Richardson | 4,091 | 15.6 | ||
| Majority | 18,043 | 68.8 | |||
| Turnout | 26,225 | 65.6 | |||
| Conservative hold | Swing | +0.0 | |||
Elections in the 1920s
| Party | Candidate | Votes | % | ± | |
|---|---|---|---|---|---|
| Unionist | Viscount Wolmer | 15,123 | 59.3 | -17.3 | |
| Liberal | Henry Fabian Orpen | 5,984 | 23.5 | n/a | |
| Labour | J.R. McPhie | 4,389 | 17.2 | -6.2 | |
| Majority | 9,139 | 35.8 | 17.4 | ||
| Turnout | 68.5 | +0.3 | |||
| Unionist hold | Swing | n/a | |||
| Party | Candidate | Votes | % | ± | |
|---|---|---|---|---|---|
| Unionist | Viscount Wolmer | 14,081 | 76.6 | +17.5 | |
| Labour | Hubert Beaumont | 4,313 | 23.4 | n/a | |
| Majority | 9,768 | 53.2 | +35.0 | ||
| Turnout | 68.2 | +8.6 | |||
| Unionist hold | Swing | n/a | |||
| Party | Candidate | Votes | % | ± | |
|---|---|---|---|---|---|
| Unionist | Viscount Wolmer | 9,131 | 59.1 | -8.3 | |
| Liberal | Alfred Jesse Suenson-Taylor | 6,315 | 40.9 | +8.3 | |
| Majority | 2,816 | 18.2 | -16.6 | ||
| Turnout | 15,446 | 59.6 | -5.2 | ||
| Unionist hold | Swing | -8.3 | |||
| Party | Candidate | Votes | % | ± | |
|---|---|---|---|---|---|
| Unionist | Viscount Wolmer | 10,952 | 67.4 | -5.0 | |
| Liberal | Harry Ainger | 5,296 | 32.6 | +5.0 | |
| Majority | 5,656 | 34.8 | -10.0 | ||
| Turnout | 64.8 | +16.8 | |||
| Unionist hold | Swing | -5.0 | |||
Elections in the 1910s
| Party | Candidate | Votes | % | ± | |
|---|---|---|---|---|---|
| Unionist | 8,755 | 72.4 | n/a | ||
| Liberal | Harry Ainger | 3,342 | 27.6 | n/a | |
| Majority | 5,413 | 44.8 | n/a | ||
| Turnout | 48.0 | n/a | |||
| Unionist win | |||||
- endorsed by Coalition Government
See also
Notes and references
- Notes
- ↑ A borough constituency (for the purposes of election expenses and type of returning officer). It was a county constituency from 1918 to 2010.
- ↑ As with all constituencies, the constituency elects one Member of Parliament (MP) by the first past the post system of election at least every five years.
- References
- ↑ "Usual Resident Population, 2011". Neighbourhood Statistics. Office for National Statistics. Retrieved 25 January 2015.
- ↑ "Electorate Figures - Boundary Commission for England". 2011 Electorate Figures. Boundary Commission for England. 4 March 2011. Retrieved 13 March 2011.
- ↑ Leigh Rayment's Historical List of MPs – Constituencies beginning with "A" (part 1)
- ↑ "Election Data 2015". Electoral Calculus. Archived from the original on 17 October 2015. Retrieved 17 October 2015.
- ↑ "Election Data 2010". Electoral Calculus. Archived from the original on 17 October 2015. Retrieved 17 October 2015.
- ↑ "Election Data 2005". Electoral Calculus. Archived from the original on 15 October 2011. Retrieved 18 October 2015.
- ↑ "Election Data 2001". Electoral Calculus. Archived from the original on 15 October 2011. Retrieved 18 October 2015.
- ↑ "Election Data 1997". Electoral Calculus. Archived from the original on 15 October 2011. Retrieved 18 October 2015.
- ↑ "Aldershot". Politicsresources.net. Retrieved 2016-07-23.
- ↑ "Election Data 1992". Electoral Calculus. Archived from the original on 15 October 2011. Retrieved 18 October 2015.
- ↑ "Politics Resources". Election 1992. Politics Resources. 9 April 1992. Retrieved 6 Dec 2010.
- ↑ "Election Data 1987". Electoral Calculus. Archived from the original on 15 October 2011. Retrieved 18 October 2015.
- ↑ "UK General Election results: June 1987". Politicsresources.net. 1987-06-11. Retrieved 2016-07-23.
- ↑ "Election Data 1983". Electoral Calculus. Archived from the original on 15 October 2011. Retrieved 18 October 2015.
- ↑ "UK General Election results: June 1983". Politicsresources.net. 1983-06-09. Retrieved 2016-07-23.
- ↑ "UK General Election results: 1979". Politicsresources.net. 1979-05-03. Retrieved 2016-07-23.
- ↑ "UK General Election results: October 1974". Politicsresources.net. 1974-10-10. Retrieved 2016-07-23.
- ↑ "UK General Election results: February 1974". Politicsresources.net. 1974-02-28. Retrieved 2016-07-23.
- ↑ "UK General Election results 1970". Politicsresources.net. 1970-06-18. Retrieved 2016-07-23.
- ↑ "UK General Election results 1966". Politicsresources.net. 1966-03-31. Retrieved 2016-07-23.
- ↑ "UK General Election results 1964". Politicsresources.net. 1964-10-15. Retrieved 2016-07-23.
- ↑ "UK General Election results 1959". Politicsresources.net. 1959-10-08. Retrieved 2016-07-23.
- ↑ "UK General Election results 1955". Politicsresources.net. 1955-05-26. Retrieved 2016-07-23.
- ↑ 1954 Aldershot by-election [Archive]
- ↑ "UK General Election results 1951". Politicsresources.net. 1951-10-25. Retrieved 2016-07-23.
- ↑ "UK General Election results 1950". Politicsresources.net. 1950-02-23. Retrieved 2016-07-23.
- ↑ "UK General Election results 1945". Politicsresources.net. 1945-07-05. Retrieved 2016-07-23.
- 1 2 3 4 British Parliamentary Election Results 1918-1949, FWS Craig
- ↑ F W S Craig, British Parliamentary Election Results 1918-1949; Political Reference Publications, Glasgow 1949
