Digital outcrop model

A Digital Outcrop Model (DOM), also called a virtual outcrop model, is a digital 3D representation of the outcrop surface, mostly in a form of textured polygon mesh.
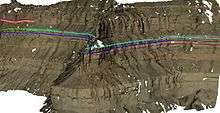
DOMs allow for interpretation and reproducible measurement[1] of different geological features, e.g. orientation of geological surfaces, width and thickness of layers. The quantity of identifiable and measurable geological features highly depends on the outcrop model resolution and accuracy.[2]
Using remote sensing techniques enables these 3D models to cover areas with difficult accessibility, e.g. several meter high cliff walls. The fact that geological interpretation can be performed on the screen, also in inaccessible areas where using conventional fieldwork methods may be unsafe, and the large quantity of data that can be collected in relatively short time are the key advantages of using DOMs.[3] Georeferencing digital outcrop models allows for integration with other spatial data, e.g. results of digital geologic mapping or GIS.
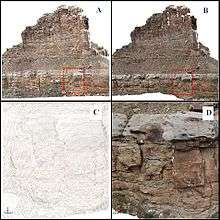
Alternatively to the photorealistic textured models 3D digital outcrop models may be represented by a point cloud coloured with the spectral (RGB) data from the corresponding images. Such surface model representation accurately describes the topography of the outcrop but due to its discrete nature is often difficult to interpret (see Figure 1.). Texturing digital polygonal outcrop models with images enhances the models with high resolution continuous data and therefore facilitates geological interpretation.[2]
Creation techniques
Creation of textured DOMs can be divided into three main steps:
- creation of the outcrop surface model,
- pre-processing and registration of images covering the outcrop,
- texture mapping.
In order to achieve the required model resolution and accuracy data are mostly collected from the ground[2] (terrestrial) or from a helicopter platform (mobile mapping).[4] Airborne and satellite data may also be integrated but mostly as complementary datasets for the outcrop areas where close-range data are missing.[5]
Digital outcrop surface model
Creation of the digital outcrop surface model consists of the following steps:
- Data acquisition
- Digital data needed to create an outcrop surface model may be obtained, as in the case of digital elevation models, from laser scanning or reconstructed from multiple images taken from multiple views using structure from motion or stereo vision techniques.[6][7] An incomplete list of software packages allowing for image based modelling can be found here.
- Models produced with the above mentioned methods may result in comparable scale and level of detail.[6] Regardless of the method applied, the primary resulting data are similar: 3D (X,Y,Z) coordinates of large number of points, in a form of a point cloud, describing the outcrop surface.
- 2. Merging point clouds and georeferencing
- Point clouds obtained from different perspectives need to be merged and registered into a single coordinate system (together with the images). In the registration process a 3D transformation is computed between common parts of two point clouds. The 3D transformation parameters can be found on the basis of the corresponding points in the two point clouds, surface matching, and in the case of mobile mapping supported by GNSS and INS, by using the direct sensor orientation method[8]
- In the point cloud georeferencing process a 3D transformation is computed between the local project coordinate system and a geodetic coordinate system. In order to complete that action minimum three points are required, that can be located in the point cloud and their coordinates in the geodetic system are known (measured using surveying methods or GNSS).
- 3. Point cloud cleaning and decimation
- Regardless of the methodology of the data acquisition, the resulting point cloud is usually filtered and cleaned from unwanted objects, e.g. vegetation. Decrease of the overall point cloud density might be required depending on the outcrop surface complexity and size of the dataset.
- 4. 3D triangulation and triangle mesh optimization
- In order to enable the possibility of model texturing, the edited point cloud is transformed into a triangulated irregular network (triangle mesh). Correct 3D data triangulation is a non-trivial task due to potential scan shadows, vegetation, sharp topography changes and random errors. Therefore additional mesh editing and optimization is often required to improve equiangularity, solve topology problems or reorient inverted surface normals.
Digital images
- Image registration
- Creation of the textured 3D models requires definition of the relationship between all the triangle mesh vertices and the corresponding image points. Collinearity condition can be used in order to find that relationship, but image interior and exterior orientation parameters need to be known.
- Interior (intrinsic) camera orientation parameters are derived from the camera calibration process.
- When laser scanning is used during the data collection, the camera is mostly coupled rigidly with the scanner and its orientation relative to the scanner is precisely measured. In such cases exterior (extrinsic) orientation parameters can be easily retrieved for all the images using 3D transformation. Otherwise it is possible to establish exterior camera orientation parameters on the basis of known coordinates of minimum three points on the 3D outcrop surface model and the image.
- In the case of a 3D outcrop surface model derived from photo modelling, the interior and exterior image orientation parameters may be computed by the modelling software.
- 2. Image pre-selection and colour balancing
- Depending on the applied rendering approach (see next section) a pre-selection of images most relevant for texture mapping might be needed.
- If the images used in the final texturing process were acquired under different illumination conditions and colours of corresponding features visible in different images differ significantly, image colour adjustment may be required.
Texture mapping
Different texture mapping algorithms exist, e.g.: single image texturing,[9] texture colour blending[10] or view-dependant texturing.[11] The single image texturing approach is often used,[3][12] due to its simplicity and efficiency.
Visualization
Visualization of large textured 3D models is still somewhat problematic and highly dependent on the hardware. The 3D nature of DOMs (multiple values for each X,Y position) results in a form of data that is not suitable for inputting to most geographical information systems. However several off-the-shelf visualization software packages exist that also allow for geological interpretation and measurements:
- RiSCAN PRO by Riegl Product website
- Sirovision by CAE Mining Product website
- ShapeMetrix3D by 3G Software & Measurement Product website; also allows for surface model extraction from multiple images
- 3DM Analyst by Adamtech Product website; also allows for surface model extraction from multiple images
- Virtual Reality Geological Studio by the University of Manchester Product website
- SketchUp by Google Product website; Not designed for handling large models with many texture materials
Digital outcrop models vs. photo panels
A photo panel is a mosaic of several images, commonly used in geology for outcrop documentation and reference to geometric object properties. Scale of such photo panels is approximately established to assess size of different geological features. However, these measures normally contain errors associated with the distortion produced during the transformation of 3D outcrops into 2D image plane and with the imprecision of the manual image stitching process.
Due to their 3D nature digital outcrop models provide correct and accurate measures of the features listed in the next section.
Data extractable from Digital Outcrop Models

- 3D lines representing[2] e.g.:
- clinoform contacts
- channel bodies and sedimentary structures
- facies contacts
- fractures
- fault
- delineation of fill-in features
- stratigraphic horizons
- local sedimentary features, e.g. tidal bundles
- strike and dip angles
- thickness and width of sedimentary units
- the material composition
- observation of various factors change over distance
Complementary data
Analysis of the digital outcrop models may be enhanced with wide variety of georeferenced digital data, e.g.:
- aerial photos
- satellite imagery
- digital terrain models
- topographic maps
- geological maps and sections
- seismic images
- gravity data
- magnetic data
- data acquired with a ground penetrating radar.[13]
- hyperspectral imagery[14]
- well core data
- well logs
- data resulting from digital geologic mapping
Using not georeferenced data with DOMs is possible but requires more work to position the auxiliary data relative to the DOM.
Applications
- Use of DOMs for outcrop analogue characterisation (i.e. geological formations similar to subsurface formations containing resources like hydrocarbons) in areas with limited accessibility or the cost of obtaining data is too high
- Geologic modelling
- increased fine-scale understanding of the geological processes
- enhancement of the reservoir model with high resolution measurements[15]
- enhance the understanding of subsurface rock formations
- input data for geological modelling derived directly from DOMs
- Enhanced oil recovery
- Teaching purposes: DOMs available prior to a field trip allow students to familiarize themselves with a location and enable the possibility to verify some of the discussion theses afterwards.[1]
See also
- 3D data acquisition and object reconstruction
- Photogrammetry
- Image-based modeling and rendering
- Geologic modelling
- Digital geologic mapping
References
- 1 2 J.A. Bellian, C. Kerans and D.C. Jennette, 2005. Digital Outcrop Models: Applications of Terrestrial Scanning Lidar Technology in Stratigraphic Modeling, Journal of Sedimentary Research, vol. 75, issue 2, pp. 166-176
- 1 2 3 4 Buckley, S.; Howell, J.; Enge, H.; Kurz, T. (2008). "Terrestrial laser scanning in geology: data acquisition, processing and accuracy considerations". Journal of the Geological Society. 165 (3): 625–638. doi:10.1144/0016-76492007-100.
- 1 2 Buckley, S.; Enge, H.; Carlsson, C.; Howell, J. (2010). "Terrestrial Laser Scanning for use in Virtual Outcrop Geology". The Photogrammetric Record. 25 (131): 225–239. doi:10.1111/j.1477-9730.2010.00585.x.
- ↑ S. Buckley, J. Vallet, A. Braathen, W. Wheeler, 2008. Oblique helicopter-based laser scanning for digital terrain modelling and visualisation of geological outcrops. IAPRS 37(B4), pp.493-498 pdf.
- ↑ Buckley, S.; Schwarz, E.; Terlaky, V.; Howell, J.; Arnott, R.W. (2010). "Combining aerial photogrammetry and terrestrial lidar for reservoir analog modeling". Photogrammetric Engineering & Remote Sensing. 76 (8): 953–963. doi:10.14358/pers.76.8.953.
- 1 2 Haneberg, W. C. (2008). "Using close range terrestrial digital photogrammetry for 3-D rock slope modeling and discontinuity mapping in the United States". Bulletin of Engineering Geology and the Environment. 67: 457–469. doi:10.1007/s10064-008-0157-y.
- ↑ F. Tonon and J. T. Kottenstette, 2006. Laser and photogrammetric methods for rock face characterization. Report on a workshop held June 17–18, 2006 in Golden, Colorado. pdf.
- ↑ M. Cramer, D. Stallmann, N. Haala, 2000. Direct Georeferencing Using Gps/inertial Exterior Orientations For Photogrammetric Applications. IAPRS, 33(Part B3), pdf
- ↑ W. Niem and H. Broszio, 1995. Mapping texture from multiple camera views onto 3D-object models for computer animation. Proceedings of the International Workshop on Stereoscopic and Three Dimensional Imaging, Santorini, Greece.
- ↑ P. Poulin, M. Ouimet,M.C. Frasson, 1998. Interactively modelling with photogrammetry. Eurographics Workshop on Rendering, Springer-Verlag, pp. 93-104.
- ↑ P.E. Debevec, C.J. Taylor, J. Malik, 1996. Modeling and rendering architecture from photographs. Proceedings of the 23rd annual conference on Computer graphics and interactive techniques, SIGGRAPH '96, New Orleans, USA.
- ↑ Riegl, 2010. RiSCAN PRO User manual. pp.119-120.
- ↑ C. Olariu, 2000. Study of cretaceous delta front deposites, integrating outcrop, GPR and 3-D photorealistic data, Panther Tongue sandstone, Utah. MSc thesis, The University of Texas at Dallas pdf
- ↑ Kurz, T.; Buckley, S.; Howell, J.; Schneider, D. (2011). "Integration of panoramic hyperspectral imaging with terrestrial lidar". Photogrammetric Record. 26 (134): 212–228. doi:10.1111/j.1477-9730.2011.00632.x.
- ↑ Enge, H. D.; Buckley, S. J.; Rotevatn, A.; Howell, J. A. (2007). "From outcrop to reservoir simulation model: Workflow and procedures". Geosphere. 3: 469–490. doi:10.1130/ges00099.1.