Islington East (UK Parliament constituency)
| Islington East | |
|---|---|
|
Former Borough constituency for the House of Commons | |
| 1885–February 1974 | |
| Number of members | one |
| Replaced by | Islington Central and Islington North |
| Created from | Finsbury |
Islington East was a constituency which returned one Member of Parliament (MP) to the House of Commons of the Parliament of the United Kingdom from 1885, until it was abolished for the February 1974 general election.
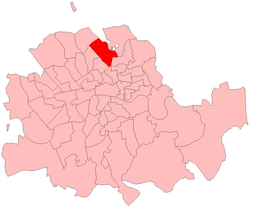
Boundaries
1885–1918
The seat was created by the Redistribution of Seats Act 1885 as one of four divisions of the new parliamentary borough of Islington. The parliamentary borough was coterminous with the civil parish of Islington and each of the four divisions consisted of a number of parish wards used for the election of vestrymen to the incorporated vestry, the local authority for the area.
The East Division consisted of two wards: Canonbury and Highbury.[1]
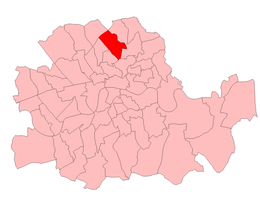
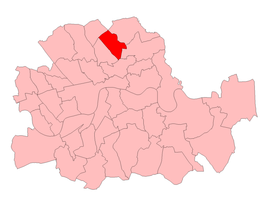
1918–1974
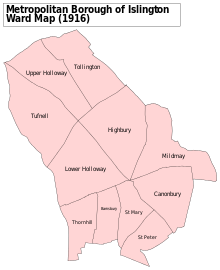
Constituencies throughout Great Britain were reorganised by the Representation of the People Act 1918. In London, seats were realigned to the boundaries of the metropolitan boroughs that had been created in 1900. The Metropolitan Borough of Islington was divided into four constituencies with the Islington, East seat consisting of three wards as they existed in 1918: Canonbury, Highbury and Mildmay. At the next parliamentary redistribution, prior to the 1950 general election, the seat was unchanged.[1]
The seat was last contested at the 1970 general election. By the time of the next election in 1974 new constituencies had been drawn based on the London boroughs created in 1965. The London Borough of Islington was divided between three constituencies, with the area of the abolished East seat mostly falling in the new Islington Central constituency.[1]
Members of Parliament
Election results
Elections in the 1880s
| Party | Candidate | Votes | % | ± | |
|---|---|---|---|---|---|
| Liberal | Henry Bret Ince | 3,296 | 50.3 | ||
| Conservative | Isaac Cowley Lambert | 3,262 | 49.7 | ||
| Majority | 34 | ||||
| Turnout | 8,092 | 81.0 | n/a | ||
| Liberal win (new seat) | |||||
| Party | Candidate | Votes | % | ± | |
|---|---|---|---|---|---|
| Conservative | Isaac Cowley Lambert | 3,732 | 61.5 | 11.8 | |
| Liberal | Henry Bret Ince | 2,336 | 38.5 | -11.8 | |
| Majority | 1,396 | ||||
| Turnout | 8,092 | 75.0 | |||
| Conservative gain from Liberal | Swing | ||||
Elections in the 1890s

| Party | Candidate | Votes | % | ± | |
|---|---|---|---|---|---|
| Conservative | Benjamin Louis Cohen | 3,975 | 53.1 | -8.4 | |
| Liberal | P.W. Bunting | 3,510 | 46.9 | 8.4 | |
| Majority | 465 | ||||
| Turnout | 9,872 | 75.8 | |||
| Conservative hold | Swing | ||||
| Party | Candidate | Votes | % | ± | |
|---|---|---|---|---|---|
| Conservative | Benjamin Louis Cohen | 4,383 | 58.1 | 5.0 | |
| Liberal | Thomas McKinnon Wood | 3,159 | 41.9 | -5.0 | |
| Majority | 1,224 | ||||
| Turnout | 10,191 | 74.0 | |||
| Conservative hold | Swing | ||||
Elections in the 1900s

| Party | Candidate | Votes | % | ± | |
|---|---|---|---|---|---|
| Conservative | Benjamin Louis Cohen | 4,205 | 61.9 | 3.8 | |
| Liberal | Andrew Mitchell Torrance | 2,586 | 38.1 | -3.8 | |
| Majority | 1,619 | ||||
| Turnout | 10,395 | 65.3 | |||
| Conservative hold | Swing | ||||

| Party | Candidate | Votes | % | ± | |
|---|---|---|---|---|---|
| Liberal | George Heynes Radford | 4477 | 54.7 | 16.6 | |
| Conservative | Sir Benjamin Louis Cohen | 3710 | 45.3 | -16.6 | |
| Majority | 767 | ||||
| Turnout | 10,786 | 75.9 | |||
| Liberal gain from Conservative | Swing | ||||
Elections in the 1910s
| Party | Candidate | Votes | % | ± | |
|---|---|---|---|---|---|
| Liberal | George Heynes Radford | 5,001 | 51.7 | -3.0 | |
| Conservative | J.H.T. Keeves | 4,671 | 48.3 | 3.0 | |
| Majority | 330 | ||||
| Turnout | 11,118 | 87.0 | |||
| Liberal hold | Swing | ||||
| Party | Candidate | Votes | % | ± | |
|---|---|---|---|---|---|
| Liberal | George Heynes Radford | 4,503 | 50.7 | -1.0 | |
| Conservative | Philip Edward Pilditch | 4,378 | 49.3 | 1.0 | |
| Majority | 125 | ||||
| Turnout | 11,118 | 79.9 | |||
| Liberal hold | Swing | ||||
General Election 1914/15:
Another General Election was required to take place before the end of 1915. The political parties had been making preparations for an election to take place and by the July 1914, the following candidates had been selected;
- Liberal: Edward Smallwood
- Unionist: Philip Edward Pilditch

| Party | Candidate | Votes | % | ± | |
|---|---|---|---|---|---|
| Liberal | Edward Smallwood | 2,709 | 57.0 | 6.3 | |
| Independent | Alfred Baker | 1,532 | 32.2 | ||
| National Party | Edmund Broughton Barnard | 513 | 10.8 | ||
| Majority | 1,177 | ||||
| Turnout | 12,874 | 36.9 | |||
| Liberal hold | Swing | ||||
| Party | Candidate | Votes | % | ± | |
|---|---|---|---|---|---|
| Unionist | Alfred Baldwin Raper | 9,352 | 48.8 | n/a | |
| Liberal | Edward Smallwood | 5,968 | 31.1 | -25.9 | |
| Labour | Arthur John Lewer | 3,122 | 16.3 | n/a | |
| National Party | Charles Edward Copplestone | 575 | 3.0 | -7.8 | |
| Independent | Frederick Alfred Wickhart | 147 | 0.8 | n/a | |
| Majority | 3,384 | 17.7 | |||
| Turnout | 51.7 | ||||
| Unionist gain from Liberal | Swing | ||||
- endorsed by the Coalition Government.
Elections in the 1920s
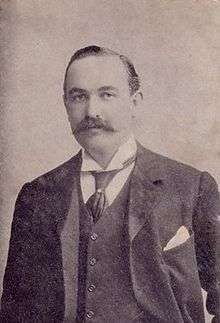
| Party | Candidate | Votes | % | ± | |
|---|---|---|---|---|---|
| Unionist | Austin Uvedale Morgan Hudson | 11,954 | 46.1 | ||
| Liberal | Sir Godfrey Baring | 8,107 | 31.2 | ||
| Labour | Ethel Bentham | 5,900 | 22.7 | ||
| Majority | 3,847 | 14.9 | |||
| Turnout | 59.4 | ||||
| Unionist hold | Swing | ||||
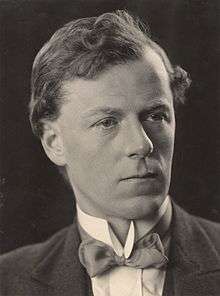
| Party | Candidate | Votes | % | ± | |
|---|---|---|---|---|---|
| Liberal | Arthur Strettell Comyns-Carr | 10,670 | 40.1 | +8.9 | |
| Unionist | Austin Uvedale Morgan Hudson | 9,038 | 33.9 | -12.2 | |
| Labour | Ethel Bentham | 6,941 | 26.0 | +3.3 | |
| Majority | 1,632 | 6.2 | 21.1 | ||
| Turnout | 60.0 | +0.6 | |||
| Liberal gain from Unionist | Swing | +10.1 | |||
| Party | Candidate | Votes | % | ± | |
|---|---|---|---|---|---|
| Unionist | Robert Inigo Tasker | 14,174 | 44.5 | +10.6 | |
| Labour | Ethel Bentham | 10,280 | 32.3 | +6.3 | |
| Liberal | Arthur Strettell Comyns-Carr | 7,406 | 23.2 | -16.9 | |
| Majority | 3,894 | 12.2 | |||
| Turnout | 70.8 | ||||
| Unionist gain from Liberal | Swing | ||||
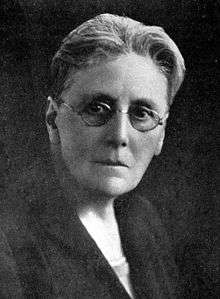
| Party | Candidate | Votes | % | ± | |
|---|---|---|---|---|---|
| Labour | Ethel Bentham | 15,199 | 38.0 | +5.7 | |
| Unionist | Robert Inigo Tasker | 13,641 | 34.1 | -10.4 | |
| Liberal | Edgar Charles Middleton | 11,136 | 27.9 | +4.7 | |
| Majority | 1,558 | 3.9 | |||
| Turnout | 66.4 | ||||
| Labour gain from Unionist | Swing | ||||
Elections in the 1930s
| Party | Candidate | Votes | % | ± | |
|---|---|---|---|---|---|
| Labour | Elizabeth Leah Manning | 10,591 | 34.7 | −3.3 | |
| Empire Crusade | Alfred Cecil Critchley | 8,314 | 27.2 | N/A | |
| Conservative | Thelma Cazalet | 7,182 | 23.5 | −10.6 | |
| Liberal | Horace Evelyn Crawfurd | 4,450 | 14.6 | −13.3 | |
| Majority | 2,277 | 7.5 | +3.6 | ||
| Turnout | 50.0 | −16.4 | |||
| Labour hold | Swing | ||||
| Party | Candidate | Votes | % | ± | |
|---|---|---|---|---|---|
| Conservative | Thelma Cazalet | 27,221 | 67.5 | +44.0 | |
| Labour | Elizabeth Leah Manning | 13,111 | 32.5 | −2.2 | |
| Majority | 14,110 | 35.0 | |||
| Turnout | 40,332 | 65.4 | +15.4 | ||
| Conservative gain from Labour | Swing | +23.1 | |||
| Party | Candidate | Votes | % | ± | |
|---|---|---|---|---|---|
| Conservative | Thelma Cazalet | 18,248 | 52.5 | −15.0 | |
| Labour | Gwyn D. Jones | 13,810 | 39.8 | +7.3 | |
| Liberal | Cyril Harry Blackburn | 2,670 | 7.7 | N/A | |
| Majority | 4,438 | 12.7 | −22.3 | ||
| Turnout | 34,728 | 57.8 | −7.6 | ||
| Conservative hold | Swing | −11.2 | |||
General Election 1939/40
Another General Election was required to take place before the end of 1940. The political parties had been making preparations for an election to take place and by the Autumn of 1939, the following candidates had been selected;
- Conservative: Thelma Cazalet
- Labour: Dr H C Boyde [4]
- Liberal: Cyril Harry Blackburn[5]
Elections in the 1940s
| Party | Candidate | Votes | % | ± | |
|---|---|---|---|---|---|
| Labour | Eric George Molyneux Fletcher | 18,936 | 65.5 | +25.7 | |
| Conservative | Thelma Cazalet-Keir | 9,960 | 34.5 | −18.0 | |
| Majority | 14,110 | 35.0 | |||
| Turnout | 28,896 | 66.2 | +6.8 | ||
| Labour gain from Conservative | Swing | +22.4 | |||
Elections in the 1950s
| Party | Candidate | Votes | % | ± | |
|---|---|---|---|---|---|
| Labour | Eric George Molyneux Fletcher | 22,477 | 55.96 | ||
| Conservative | Mrs Katherine Wilmot | 14,385 | 35.82 | ||
| Liberal | Thomas Herbert Coss Billson | 3,301 | 8.22 | ||
| Majority | 8,062 | 20.15 | |||
| Turnout | 79.30 | ||||
| Labour hold | |||||
| Party | Candidate | Votes | % | ± | |
|---|---|---|---|---|---|
| Labour | Eric George Molyneux Fletcher | 23,896 | 59.9 | ||
| Conservative | Mrs Katherine Wilmot | 16,000 | 40.1 | ||
| Majority | 7,896 | 19.79 | |||
| Turnout | 78.23 | ||||
| Labour hold | |||||
| Party | Candidate | Votes | % | ± | |
|---|---|---|---|---|---|
| Labour | Eric George Molyneux Fletcher | 19,612 | 60.3 | ||
| Conservative | Geoffrey Finsberg | 12,910 | 39.7 | ||
| Majority | 6,702 | 20.61 | |||
| Turnout | 66.06 | ||||
| Labour hold | |||||
| Party | Candidate | Votes | % | ± | |
|---|---|---|---|---|---|
| Labour | Eric George Molyneux Fletcher | 17,776 | 57.56 | -2.74 | |
| Conservative | Kenneth C Burden | 13,097 | 42.44 | +2.74 | |
| Majority | 4,669 | 15.13 | -5.48 | ||
| Turnout | 30,683 | 63.49 | -2.57 | ||
| Labour hold | |||||
Elections in the 1960s
| Party | Candidate | Votes | % | ± | |
|---|---|---|---|---|---|
| Labour | Eric George Molyneux Fletcher | 14,192 | 52.48 | -5.04 | |
| Conservative | Kenneth C Burden | 7,715 | 28.53 | -13.91 | |
| Liberal | Joel Freedman | 3,081 | 11.39 | N/A | |
| Independent Liberal | Alan E Lomas | 2,053 | 7.59 | N/A | |
| Majority | 6,477 | 23.95 | +8.82 | ||
| Turnout | 57.11 | -6.38 | |||
| Labour hold | |||||
| Party | Candidate | Votes | % | ± | |
|---|---|---|---|---|---|
| Labour | Eric George Molyneux Fletcher | 15,009 | 57.92 | +5.44 | |
| Conservative | John B W Holderness | 7,490 | 28.90 | +0.37 | |
| Liberal | Joel Freedman | 2,288 | 8.83 | -2.56 | |
| Independent Liberal | Alan E Lomas | 1,127 | 4.35 | -3.24 | |
| Majority | 7,519 | 29.02 | +5.07 | ||
| Turnout | 25,914 | 57.06 | +0.5 | ||
| Labour hold | |||||
Elections in the 1970s
| Party | Candidate | Votes | % | ± | |
|---|---|---|---|---|---|
| Labour | John Douglas Grant | 13,980 | 61.75 | +3.83 | |
| Conservative | Richard Devonald-Lewis | 8,660 | 38.25 | +9.35 | |
| Majority | 5,320 | 23.50 | -5.52 | ||
| Turnout | 22,350 | 51.80 | -5.26 | ||
| Labour hold | |||||
See also
References
- 1 2 3 Youngs, Frederic A, Jr. (1979). Guide to the Local Administrative Units of England, Vol.I: Southern England. London: Royal Historical Society. pp. 742–748. ISBN 0-901050-67-9.
- 1 2 3 4 5 6 7 8 British parliamentary election results, 1885-1918 (Craig)
- 1 2 3 4 5 6 7 8 British Parliamentary Election Results 1918-1949, FWS Craig
- ↑ Report of the Annual Conference of the Labour Party, 1939
- ↑ The Liberal Magazine, 1939
- 1 2 3 4 5 British parliamentary election results, 1950-1973 by FWS Craig
- ↑ F W S Craig, British Parliamentary Election Results 1950-1973; Political Reference Publications, Glasgow 1973
- ↑ F W S Craig, British Parliamentary Election Results 1950-1973; Political Reference Publications, Glasgow 1973
- British Parliamentary Election Results 1885-1918, compiled and edited by F.W.S. Craig (Macmillan Press 1974)
- Debrett’s Illustrated Heraldic and Biographical House of Commons and the Judicial Bench 1886
- Debrett’s House of Commons and the Judicial Bench 1901
- Debrett’s House of Commons and the Judicial Bench 1918
- Leigh Rayment's Historical List of MPs – Constituencies beginning with "I"