Economy of the United States by sector
The economy of the United States is subdivided into economic sectors in different ways by different organizations. The North American Industry Classification System (NAICS) was developed in 1997 and is used by the United States Census Bureau, while the older Standard Industrial Classification is used at the U.S. Securities and Exchange Commission (SEC).
Economic Census
The United States Census Bureau currently conducts a comprehensive Economic Census[1] every five years. The results of this survey are tabulated according to the NAICS and provide statistics about the U.S. economy. The most recent data are from 2007.[2] The 2012 Economic Census is underway with the initial results to be available in December 2013.[3]
Comparative statistics
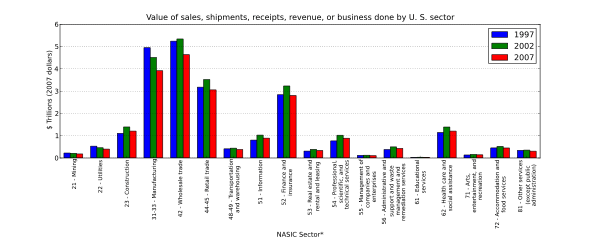
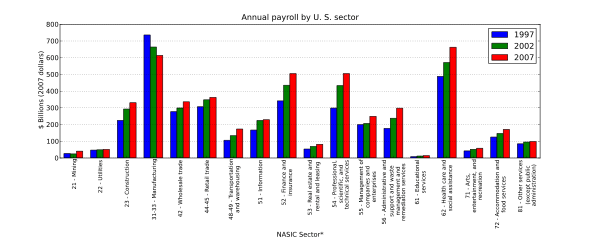
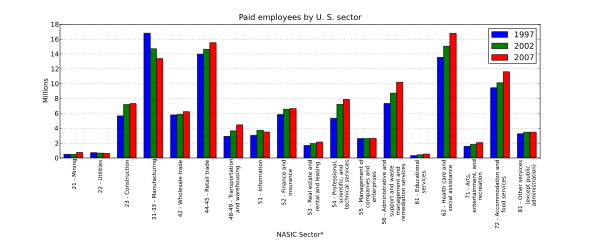
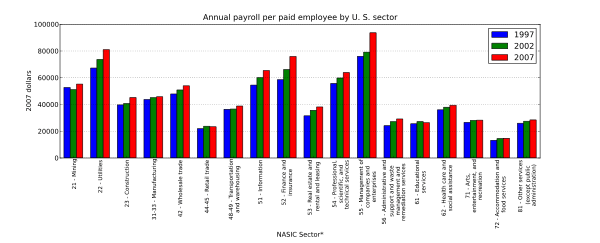
The Census Bureau releases sector-by-sector statistics on the number of establishments, total business activity, annual payroll, and number of paid employees. A standardized classification of the economy into sectors makes it possible to compare census results over time. However, to reflect the evolving nature of the economy, the NAICS is updated every five years. Therefore, when comparing different censuses, a particular NAICS basis is usually specified. The following data are based on a comparison of the 2007 and 2002 censuses using the 2002 NAICS basis and an older comparison of the 1997 and 2002 censuses using the older 1997 NAICS basis. Thus, (*) the 1997 data are based on a slightly different classification than the 2007 and 2002 data.

2002 statistics
- Sectors of the U.S. Economy in 2002 - firms with payroll - All Sector Totals[4]
| Sector | Establishments | Sales, receipts, or shipments ($1,000) | Annual payroll ($1,000) | Paid employees |
|---|---|---|---|---|
| Mining | 24,087 | 182,911,093 | 21,173,895 | 477,840 |
| Utilities | 17,103 | 398,907,044 | 42,417,830 | 663,044 |
| Construction | 710,307 | 1,196,555,587 | 254,292,144 | 7,193,069 |
| Manufacturing | 350,828 | 3,916,136,712 | 576,170,541 | 14,699,536 |
| Wholesale trade | 435,521 | 4,634,755,112 | 259,653,080 | 5,878,405 |
| Retail trade | 1,114,637 | 3,056,421,997 | 302,113,581 | 14,647,675 |
| Transportation & warehousing | 199,618 | 382,152,040 | 115,988,733 | 3,650,859 |
| Information | 137,678 | 891,845,956 | 194,670,163 | 3,736,061 |
| Finance & insurance | 440,268 | 2,803,854,868 | 377,790,172 | 6,578,817 |
| Real estate & rental & leasing | 322,815 | 335,587,706 | 60,222,584 | 1,948,657 |
| Professional, scientific, & technical services | 771,305 | 886,801,038 | 376,090,052 | 7,243,505 |
| Management of companies & enterprises | 49,308 | 107,064,264 | 178,996,060 | 2,605,292 |
| Administrative & support & waste management & remediation service | 350,583 | 432,577,580 | 206,439,329 | 8,741,854 |
| Educational services | 49,319 | 30,690,707 | 10,164,378 | 430,164 |
| Health care & social assistance | 704,526 | 1,207,299,734 | 495,845,829 | 15,052,255 |
| Arts, entertainment, & recreation | 110,313 | 141,904,109 | 45,169,117 | 1,848,674 |
| Accommodation & food services | 565,590 | 449,498,718 | 127,554,483 | 10,120,951 |
| Other services (except public administration) | 537,576 | 307,049,461 | 82,954,939 | 3,475,310 |
| Totals | 6,891,382 | 21,362,013,726 | 3,727,706,910 | 108,991,968 |
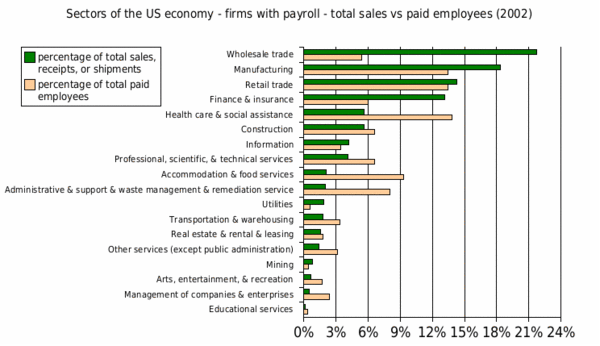 Sales and employees by sector within the United States economy in 2002. |
 Sectors of the US economy ranked by number of sales, receipts, or shipments in the year 2002. Includes both employers and nonemployers |
See also
References
- ↑ Economic Census: http://www.census.gov/econ/census/
- ↑ 2007 Economic Census: http://www.census.gov/econ/census07/
- ↑ 2012 Economic Census: http://www.census.gov/econ/census/index.html
- ↑ 2002 Economic Census - Summary Statistics by 2002 NAICS: http://www.census.gov/econ/census02/data/us/US000.HTM