Harrow London Borough Council elections
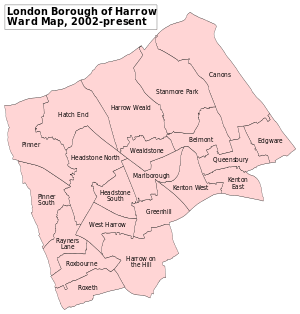
Harrow London Borough Council in London, England is elected every four years. Since the last boundary changes in 2002, 63 councillors are elected from 21 wards.[1]
Political control
Since 1964, political control of the council has been held by the following parties:[2][3]
| Party in control | Years |
|---|---|
| Conservative | 1964 - 1971 |
| Labour (minority) | 1971 - 1974 |
| Conservative | 1974 - 1994 |
| Liberal Democrat (minority) | 1994 - 1998 |
| Labour | 1998 - 2002 |
| Labour (minority) | 2002 - 2006 |
| Conservative | 2006 - 2010 |
| Labour | 2010 - 2013 |
| Coalition (Conservatives and Independent Labour) | 2013 |
| Conservatives (minority) | 2013 - 2014 |
| Labour | 2014–present |
Council elections
- Harrow London Borough Council election, 1964
- Harrow London Borough Council election, 1968
- Harrow London Borough Council election, 1971
- Harrow London Borough Council election, 1974
- Harrow London Borough Council election, 1978 (boundary changes increased the number of seats by seven)[4]
- Harrow London Borough Council election, 1982
- Harrow London Borough Council election, 1986
- Harrow London Borough Council election, 1990
- Harrow London Borough Council election, 1994 (boundary changes took place but the number of seats remained the same)[n 1][n 2]
- Harrow London Borough Council election, 1998
- Harrow London Borough Council election, 2002 (boundary changes took place but the number of seats remained the same)[5][6]
- Harrow London Borough Council election, 2006
- Harrow London Borough Council election, 2010
- Harrow London Borough Council election, 2014
Borough result maps
 2002 results map
 2006 results map
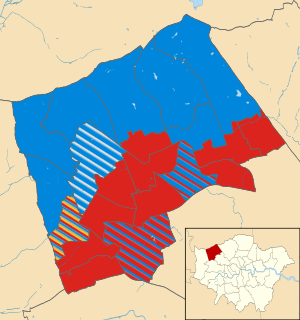 2010 results map
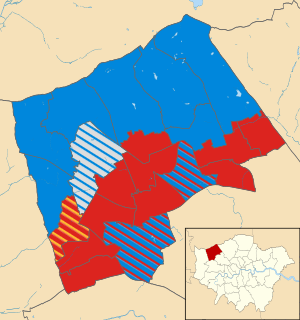 2014 results map
By-election results
1964-1968
There were no by-elections.[7]
1968-1971
| Party | Candidate | Votes | % | ± | |
|---|---|---|---|---|---|
| Conservative | J. O. Edis | 946 | |||
| Liberal | J. E. H. Davies | 532 | |||
| Labour | A. H. Elderton | 454 | |||
| Union Movement | R. H. F. Smyth | 45 | |||
| Communist | Mrs. M. I. Robinson | 24 | |||
| Turnout | 26.1% | ||||
| Party | Candidate | Votes | % | ± | |
|---|---|---|---|---|---|
| Conservative | Mrs. D. E. Wells | 1467 | |||
| Liberal | Dr. J. H. Paterson | 514 | |||
| Labour | B. B. Myers | 425 | |||
| Communist | R. A. Ward | 59 | |||
| Union Movement | F. E. Lee | 25 | |||
| Turnout | 19.1% | ||||
| Party | Candidate | Votes | % | ± | |
|---|---|---|---|---|---|
| Conservative | Mrs. J. R. Keen | 799 | |||
| Liberal | R. S. Montgomerie | 445 | |||
| Labour | A. J. Lovell | 294 | |||
| Turnout | 20.5% | ||||
| Party | Candidate | Votes | % | ± | |
|---|---|---|---|---|---|
| Conservative | M. A. Murphy | 1865 | |||
| Liberal | W. R. Westaway | 591 | |||
| Labour | B. C. Perigoe | 267 | |||
| Union Movement | K. M. Thompson | 76 | |||
| Turnout | 22.0% | ||||
| Party | Candidate | Votes | % | ± | |
|---|---|---|---|---|---|
| Conservative | J. A. Campbell | 1402 | |||
| Liberal | J. E. H. Davies | 773 | |||
| Labour | D. J. R. Howard | 350 | |||
| Turnout | 27.3% | ||||
| Party | Candidate | Votes | % | ± | |
|---|---|---|---|---|---|
| Conservative | W. M. Buckland | 1187 | |||
| Liberal | G. O. Abbott | 1118 | |||
| Labour | D. J. R. Howard | 305 | |||
| Turnout | 31.7% | ||||
1971-1974
| Party | Candidate | Votes | % | ± | |
|---|---|---|---|---|---|
| Labour | A. H. Tidmarsh | 2,615 | |||
| Conservative | Miss C. A. Bednell | 740 | |||
| Liberal | J. S. W. Branch | 188 | |||
| Union Movement | D. J. Wilson | 53 | |||
| Turnout | 33.9% | ||||
| Party | Candidate | Votes | % | ± | |
|---|---|---|---|---|---|
| Conservative | B. J. Simmonds | 1,192 | |||
| Labour | G. W. Temple | 888 | |||
| Independent | R. S. Sullivan | 681 | |||
| Liberal | A. T. Ketteringham | 383 | |||
| National Front | R. Franklin | 216 | |||
| Harrow Youth Movement | R. N. S. Keidan | 67 | |||
| Independent Conservative | E. J. O. Hixon | 22 | |||
| Turnout | 41.5% | ||||
| Party | Candidate | Votes | % | ± | |
|---|---|---|---|---|---|
| Conservative | N. J. Cervantes-Watson | 976 | |||
| Labour | A. K. Toms | 777 | |||
| Liberal | Mrs M. E. Wakefield | 364 | |||
| Action Party | K. M. Thompson | 203 | |||
| Turnout | 29.9% | ||||
| Party | Candidate | Votes | % | ± | |
|---|---|---|---|---|---|
| Conservative | A. B. C. Turner | 1,351 | |||
| Labour | S. L. Soskin | 1,044 | |||
| Liberal | R. S. Montgomerie | 804 | |||
| National Front | C. A. Byrne | 360 | |||
| Independent | R. S. Sullivan | 270 | |||
| Turnout | 41.2% | ||||
| Party | Candidate | Votes | % | ± | |
|---|---|---|---|---|---|
| Labour | A. Bradshaw | 1,270 | |||
| Conservative | Mrs M. R. Crick | 520 | |||
| Liberal | P. N. P. Williams | 364 | |||
| National Front | C. A. Byrne | 259 | |||
| Turnout | 31.0% | ||||
1974-1978
| Party | Candidate | Votes | % | ± | |
|---|---|---|---|---|---|
| Labour | William J. Short | 853 | |||
| Conservative | William D. Harris | 769 | |||
| Liberal | Peter N. P. Williams | 598 | |||
| National Front | Peter Orsmond | 225 | |||
| Turnout | 31.2 | ||||
| Party | Candidate | Votes | % | ± | |
|---|---|---|---|---|---|
| Conservative | Frank E. Weare | 1,850 | |||
| Liberal | Clifford S. Thomas | 999 | |||
| Labour | Alexander J. Bruce | 595 | |||
| National Front | Geoffrey W. Spratt | 215 | |||
| Turnout | 44.6 | ||||
1990-1994
| Party | Candidate | Votes | % | ± | |
|---|---|---|---|---|---|
| Liberal Democrat | Laurence J. Cox | 1,351 | 46.7 | ||
| Conservative | Robert E. Goodman | 1,176 | 40.7 | ||
| Labour | Jack Gilbert | 363 | 12.6 | ||
| Turnout | 40.4 | ||||
| Liberal Democrat gain from Conservative | Swing | ||||
The by-election was called following the resignation of Cllr. Richard J. Denney.
| Party | Candidate | Votes | % | ± | |
|---|---|---|---|---|---|
| Conservative | Mark A. Mallon | 1,421 | 45.2 | ||
| Liberal Democrat | Graham D. Finch | 1,202 | 38.2 | ||
| Labour | Susan C. Thomason | 467 | 14.9 | ||
| Liberal | Donald O. Bruce | 53 | 1.7 | ||
| Turnout | 45.2 | ||||
| Conservative hold | Swing | ||||
The by-election was called following the death of Cllr. Charles D. Green.
| Party | Candidate | Votes | % | ± | |
|---|---|---|---|---|---|
| Conservative | Garry C. Leon | 1,049 | 45.8 | ||
| Liberal Democrat | Ronald D. Warshaw | 962 | 42.0 | ||
| Labour | Charles E. Blake | 279 | 12.2 | ||
| Turnout | 37.3 | ||||
| Conservative hold | Swing | ||||
The by-election was called following the resignation of Cllr. Ronald P. Grant.
| Party | Candidate | Votes | % | ± | |
|---|---|---|---|---|---|
| Liberal Democrat | Brian G. T. Williams | 1,916 | 65.0 | ||
| Conservative | Thomas G. Brown | 562 | 19.1 | ||
| Labour | Archie T. Foulds | 470 | 15.9 | ||
| Turnout | 40.1 | ||||
| Liberal Democrat hold | Swing | ||||
The by-election was called following the resignation of Cllr. Howard C. Cooper.
| Party | Candidate | Votes | % | ± | |
|---|---|---|---|---|---|
| Lib Dem Focus Team | Maureen De Beer | 1,092 | 45.6 | ||
| Labour | Jeffrey A. Anderson | 747 | 31.2 | ||
| Conservative | Anthony H. Seymour | 555 | 23.2 | ||
| Turnout | 41.7 | ||||
| Lib Dem Focus Team gain from Conservative | Swing | ||||
The by-election was called following the death of Cllr. Leslie Nixon.
1994-1998
| Party | Candidate | Votes | % | ± | |
|---|---|---|---|---|---|
| Liberal Democrat | Clifford S. Thomas | 1,282 | |||
| Labour | Archie T. Foulds | 1,009 | |||
| Conservative | John B. Rennie | 268 | |||
| Independent | Roy Edey | 36 | |||
| Independent | Colin R. P. Manton | 37 | |||
| Turnout | |||||
| Liberal Democrat hold | Swing | ||||
The by-election was called following the resignation of Cllr. Derek R. Wiseman.
| Party | Candidate | Votes | % | ± | |
|---|---|---|---|---|---|
| Liberal Democrat | Robert L. Pinkus | 1,444 | |||
| Labour | Colin S. Crouch | 719 | |||
| Conservative | Thomas G. Brown | 562 | |||
| Turnout | |||||
| Liberal Democrat hold | Swing | ||||
The by-election was called following the resignation of Cllr. Brian G. T. Williams.
| Party | Candidate | Votes | % | ± | |
|---|---|---|---|---|---|
| Liberal Democrat | Adrien P. Smith | 1,071 | |||
| Conservative | Leonard G. C. Harsant | 808 | |||
| Labour | Brian E. Gate | 682 | |||
| Turnout | |||||
| Liberal Democrat hold | Swing | ||||
The by-election was called following the resignation of Cllr. Norah B. Murphy.
| Party | Candidate | Votes | % | ± | |
|---|---|---|---|---|---|
| Labour | Cyril B. Harrison | 1,036 | |||
| Conservative | Jeremy S. Zeid | 335 | |||
| Liberal Democrat | Stanley Sheinwald | 229 | |||
| Green | David P. P. Edler | 54 | |||
| Turnout | |||||
| Labour hold | Swing | ||||
The by-election was called following the resignation of Cllr. Gareth R. Thomas.
| Party | Candidate | Votes | % | ± | |
|---|---|---|---|---|---|
| Labour | Brian E. Gate | 827 | |||
| Liberal Democrat | Edward P. Tiley | 694 | |||
| Conservative | Leonard G. C. Harsant | 690 | |||
| Independent | Marjorie S. Warwick | 44 | |||
| Turnout | |||||
| Labour gain from Liberal Democrat | Swing | ||||
The by-election was called following the resignation of Cllr. Andrew D. Wiseman.
| Party | Candidate | Votes | % | ± | |
|---|---|---|---|---|---|
| Labour | Jeremy J. Miles | 1,045 | |||
| Independent Resident | Charles E. M. Cox | 1,024 | |||
| Conservative | Mohammad A. Kaiseriman | 165 | |||
| Turnout | |||||
| Labour gain from Independent Resident | Swing | ||||
The by-election was called following the death of Cllr. Alan W. Hamlin.
| Party | Candidate | Votes | % | ± | |
|---|---|---|---|---|---|
| Labour | Keith Burchell | 1,476 | |||
| Conservative | Henry S. Venour | 360 | |||
| Liberal Democrat | Jaydeep K. Patel | 295 | |||
| Socialist Labour | Jack Gilbert | 112 | |||
| Turnout | |||||
| Labour hold | Swing | ||||
The by-election was called following the resignation of Cllr. Tony J. McNulty.
1998-2002
| Party | Candidate | Votes | % | ± | |
|---|---|---|---|---|---|
| Labour | Margaret A. Davine | 1,425 | 56.8 | -3.8 | |
| Conservative | Gary S. Hughes | 696 | 27.7 | +3.5 | |
| Liberal Democrat | David B. Sandford | 388 | 15.5 | +0.4 | |
| Majority | 729 | 29.1 | |||
| Turnout | 2,509 | 26.7 | |||
| Labour hold | Swing | ||||
The by-election was called following the death of Cllr. Robert H. Lawrence.
| Party | Candidate | Votes | % | ± | |
|---|---|---|---|---|---|
| Labour | Alan G. Blann | 988 | 55.8 | -10.5 | |
| Liberal Democrat | Brian K. Campbell | 440 | 24.8 | +10.3 | |
| Conservative | Nisam S. Butt | 343 | 19.4 | +2.9 | |
| Majority | 548 | 31.0 | |||
| Turnout | 1,771 | 26.1 | |||
| Labour hold | Swing | ||||
The by-election was called following the death of Cllr. Ann L. Swaine.
| Party | Candidate | Votes | % | ± | |
|---|---|---|---|---|---|
| Conservative | Paul S. Osborn | 1,062 | 57.7 | -4.3 | |
| Labour | Joseph T. Lilley | 478 | 26.0 | +2.1 | |
| Liberal Democrat | Veronica M. Chamberlain | 250 | 13.6 | -0.5 | |
| Independent | Herbert W. Crossman | 51 | 2.8 | +2.8 | |
| Majority | 584 | 31.7 | |||
| Turnout | 1,841 | 23.8 | |||
| Conservative hold | Swing | ||||
The by-election was called following the death of Cllr. Antony C. Cocksedge.
2002-2006
There were no by-elections.[12]
2006-2010
| Party | Candidate | Votes | % | ± | |
|---|---|---|---|---|---|
| Liberal Democrat | Paul E. Scott | 1,288 | 46.9 | +12.0 | |
| Conservative | Brian R. Jones | 1,088 | 39.6 | -6.1 | |
| Labour | Howard S. Bluston | 295 | 10.7 | -8.7 | |
| Green | Sarah A. Kersey | 74 | 2.7 | +2.7 | |
| Majority | 200 | 7.3 | |||
| Turnout | 2,745 | 33.5 | |||
| Liberal Democrat gain from Conservative | Swing | ||||
The by-election was called following the death of Cllr. John B. Anderson.
| Party | Candidate | Votes | % | ± | |
|---|---|---|---|---|---|
| Conservative | Musarrat H. Akhtar | 1,208 | 56.7 | -11.1 | |
| Labour | Richard Harrod | 389 | 18.3 | -0.1 | |
| Liberal Democrat | Anne D. Diamond | 296 | 13.9 | +0.1 | |
| Independent | Marcello Borgese | 182 | 8.5 | +8.5 | |
| BNP | Howard J. Studley | 56 | 2.6 | +2.6 | |
| Majority | 819 | 38.4 | |||
| Turnout | 2,131 | 24.0 | |||
| Conservative hold | Swing | ||||
The by-election was called following the death of Cllr. Janet R. Cowan.
| Party | Candidate | Votes | % | ± | |
|---|---|---|---|---|---|
| Labour | Krishna James | 972 | 41.4 | -2.1 | |
| Liberal Democrat | Peter D. J. Budden | 628 | 26.7 | +3.1 | |
| Conservative | Kamaljit S. Chana | 507 | 21.6 | -11.3 | |
| BNP | Howard J. Studley | 97 | 4.1 | +4.1 | |
| Independent | Herbert W. Crossman | 74 | 3.2 | +3.2 | |
| Green | Antony F. Rablen | 71 | 3.0 | +3.0 | |
| Majority | 344 | 14.4 | |||
| Turnout | 2,349 | 29.6 | |||
| Labour hold | Swing | ||||
The by-election was called following the death of Cllr. Dhirajlal Lavingia.
2010-2014
| Party | Candidate | Votes | % | ± | |
|---|---|---|---|---|---|
| Conservative | Amir Moshenson | 1495 | |||
| Labour | Nitin Parekh | 774 | |||
| Liberal Democrat | Darren S. Diamond | 236 | |||
| Turnout | 26.1% | ||||
| Conservative hold | Swing | ||||
The by-election was called following the death of Cllr. John Cowan.
| Party | Candidate | Votes | % | ± | |
|---|---|---|---|---|---|
| Conservative | Ms. Marilyn J. Ashton | 1395 | |||
| Labour | Niraj Dattani | 509 | |||
| Independent | Eric Silver | 299 | |||
| Liberal Democrat | Ms. Sylvia Warshaw | 98 | |||
| Green | Ms. Linda C. Robinson | 53 | |||
| UKIP | Herbert W. Crossman | 48 | |||
| Turnout | 27.6% | ||||
| Conservative hold | Swing | ||||
The by-election was called following the resignation of Cllr. Mark A. Versallion.
| Party | Candidate | Votes | % | ± | |
|---|---|---|---|---|---|
| Labour | Christine Robson | 1,042 | 47.6 | +7.2 | |
| Conservative | Julia Merison | 761 | 34.7 | -1.3 | |
| UKIP | Jeremy Zeid | 171 | 7.8 | +6.0 | |
| Green | Rowan Langley | 96 | 4.4 | +4.4 | |
| Liberal Democrat | Prakash Nandhra | 68 | 3.1 | -16.0 | |
| Independent | Herbert Crossman | 53 | 2.4 | +2.4 | |
| Majority | 281 | 12.8 | +8.8 | ||
| Turnout | 2,191 | 28.5 | -40.3 | ||
| Labour hold | Swing | 4.3% | |||
The by-election was called following the resignation of Cllr. Brian E. Gate.
| Party | Candidate | Votes | % | ± | |
|---|---|---|---|---|---|
| Labour | Glen Hearnden | 991 | 38.9 | +2.1 | |
| Conservative | Stephen Lewis | 836 | 32.8 | -2.4 | |
| Independent | Eileen Kinnear | 308 | 12.1 | +5.0 | |
| Harrow First | Gajan Idaikkadar | 173 | 6.8 | +6.8 | |
| UKIP | Jeremy Zeid | 168 | 6.6 | +6.6 | |
| Liberal Democrat | Gaye Branch | 70 | 2.7 | -10.2 | |
| Majority | 155 | 6.1 | +4.5 | ||
| Turnout | 2,546 | 29.2 | -31.4 | ||
| Labour hold | Swing | 2.3% | |||
The by-election was called following the resignation of Cllr. Ms. Ann Gate.
2014-2018
There have been no by-elections so far.
References
- ↑ "Political balance of the council". Harrow Council. Retrieved 2009-09-07.
- ↑ "Harrow". BBC News Online. 19 April 2009. Retrieved 2010-05-08.
- ↑ "BBC News - Tories get control of Harrow Council after Labour split". BBC. Retrieved 13 October 2013.
- 1 2 3 "London Borough Council Elections 4 May 1978" (PDF). London Datastore. Greater London Council. Retrieved 25 February 2015.
- ↑ "Harrow". BBC News Online. Retrieved 2009-09-07.
- 1 2 3 4 "London Borough Council Elections 2 May 2002" (PDF). London Datastore. Greater London Authority. Retrieved 25 February 2015.
- ↑ "London Borough Council Elections 9 May 1968" (PDF). London Datastore. Greater London Council. Retrieved 24 February 2015.
- 1 2 3 4 5 6 "London Borough Council Elections 13 May 1971" (PDF). London Datastore. Greater London Council. Retrieved 3 March 2015.
- 1 2 3 4 5 "London Borough Council Elections 2 May 1974" (PDF). London Datastore. Greater London Council. Retrieved 25 February 2015.
- 1 2 3 4 5 "London Borough Council By-elections May 1990 to May 1994" (PDF). London Datastore. London Research Centre. Retrieved 8 March 2015.
- 1 2 3 4 5 6 7 "London Borough Council Elections 7 May 1998 including the Greater London Authority Referendum results" (PDF). London Datastore. London Research Centre. Retrieved 8 March 2015.
- ↑ "London Borough Council Elections 4 May 2006" (PDF). London Datastore. Greater London Authority. Retrieved 7 March 2015.
- ↑ "By-election of borough councillor for the Harrow Weald ward" (PDF). Harrow Council. Retrieved 2009-09-07.
- ↑ "By-election of borough councillor for the Canons ward" (PDF). Harrow Council. Retrieved 2009-09-07.
- ↑ "By-election of borough councillor for the Marlborough ward" (PDF). Harrow Council. Retrieved 2009-09-07.
- 1 2 "London Borough Council Elections 22 May 2014" (PDF). London Datastore. Greater London Authority. Retrieved 26 February 2015.
- ↑ "West Harrow Election Results, 2002-2013" (PDF). Retrieved 13 October 2013.
- ↑ "Harrow-on-the-Hill Election Results, 2002-2013" (PDF). Retrieved 2 December 2013.