Ilkeston (UK Parliament constituency)
| Ilkeston | |
|---|---|
|
Former County constituency for the House of Commons | |
| 1885–1983 | |
| Number of members | one |
| Replaced by | Amber Valley and Erewash[1] |
| Created from | Derbyshire South |
Ilkeston is a former United Kingdom Parliamentary constituency. It was a constituency of the House of Commons of the Parliament of the United Kingdom. It was represented by one Member of Parliament. In 1983 it was abolished, together with South East Derbyshire, when the Derbyshire county constituencies were redrawn - the constituencies of Amber Valley and Erewash were created and the constituency of South Derbyshire was re-created. The constituency of Bolsover was not abolished although it was created in 1950 together with South East Derbyshire.
Boundaries
1918-1950: The Municipal Borough of Ilkeston, the Urban Districts of Heanor and Ripley, and the Rural District which consisted of the civil parishes of Codnor Park and Shipley.
1950-1983: The Municipal Borough of Ilkeston, the Urban Districts of Alfreton, Heanor, and Ripley, and in the Rural District of Belper the civil parish of Shipley.
Members of Parliament
| Election | Member | Party | |
|---|---|---|---|
| 1885 | Thomas Watson | Liberal | |
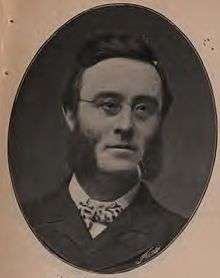
| 1887 | Sir Walter Foster | Liberal | |
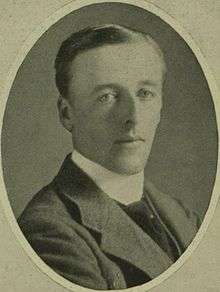
| 1910 | Jack Seely | Liberal | |
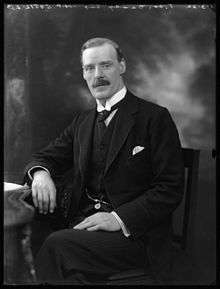
| 1922 | George Oliver | Labour | |
| 1931 | Abraham Flint | National Labour | |
| 1935 | George Oliver | Labour | |
| 1964 | Ray Fletcher | Labour | |
| 1983 | constituency abolished | ||
Elections
Elections in the 1880s
| Party | Candidate | Votes | % | ± | |
|---|---|---|---|---|---|
| Liberal | Thomas Watson | 5,780 | 60.4 | n/a | |
| Conservative | WDN Drury Lowe | 3,793 | 39.6 | n/a | |
| Majority | 1,987 | 20.8 | n/a | ||
| Turnout | 89.8 | n/a | |||
| Liberal win (new seat) | |||||
| Party | Candidate | Votes | % | ± | |
|---|---|---|---|---|---|
| Liberal | Thomas Watson | 4,621 | 54.9 | -5.5 | |
| Conservative | Samuel Leeke | 3,793 | 45.1 | +5.5 | |
| Majority | 828 | 9.8 | -11.0 | ||
| Turnout | 78.9 | -10.9 | |||
| Liberal hold | Swing | -5.5 | |||

| Party | Candidate | Votes | % | ± | |
|---|---|---|---|---|---|
| Liberal | Sir Balthazar Walter Foster | 5,512 | 56.9 | +2.0 | |
| Conservative | Samuel Leeke | 4,180 | 43.1 | -2.0 | |
| Majority | 1,332 | 13.8 | +4.0 | ||
| Turnout | 88.5 | +9.6 | |||
| Liberal hold | Swing | +2.0 | |||
Elections in the 1890s
| Party | Candidate | Votes | % | ± | |
|---|---|---|---|---|---|
| Liberal | Sir Balthazar Walter Foster | 6,185 | 58.4 | +1.5 | |
| Conservative | Samuel Leeke | 4,402 | 41.6 | -1.5 | |
| Majority | 1,783 | 16.8 | +3.0 | ||
| Turnout | 78.2 | -10.3 | |||
| Liberal hold | Swing | +1.5 | |||
| Party | Candidate | Votes | % | ± | |
|---|---|---|---|---|---|
| Liberal | Sir Balthazar Walter Foster | 6,215 | 54.2 | -4.2 | |
| Conservative | Edward Picton Baumgarten | 5,254 | 45.8 | +4.2 | |
| Majority | 961 | 8.4 | -8.4 | ||
| Turnout | 87.1 | +8.9 | |||
| Liberal hold | Swing | -4.2 | |||
Elections in the 1900s
| Party | Candidate | Votes | % | ± | |
|---|---|---|---|---|---|
| Liberal | Sir Balthazar Walter Foster | 6,633 | 53.8 | -0.4 | |
| Conservative | Henry FitzHerbert Wright | 5,698 | 46.2 | +0.4 | |
| Majority | 935 | 7.6 | -0.8 | ||
| Turnout | 84.9 | -2.2 | |||
| Liberal hold | Swing | -0.4 | |||
| Party | Candidate | Votes | % | ± | |
|---|---|---|---|---|---|
| Liberal | Rt Hon. Sir Balthazar Walter Foster | 9,655 | 64.3 | +10.5 | |
| Conservative | LC Tipper | 5,358 | 35.7 | -10.5 | |
| Majority | 4,297 | 28.6 | +21.0 | ||
| Turnout | 87.2 | ||||
| Liberal hold | Swing | +10.5 | |||
Elections in the 1910s
| Party | Candidate | Votes | % | ± | |
|---|---|---|---|---|---|
| Liberal | Rt Hon. Sir Balthazar Walter Foster | 10,632 | 62.3 | -2.0 | |
| Conservative | Forbes St John Morrow | 6,432 | 37.7 | +2.0 | |
| Majority | 4,200 | 24.6 | -4.0 | ||
| Turnout | 87.7 | +0.5 | |||
| Liberal hold | Swing | -2.0 | |||

| Party | Candidate | Votes | % | ± | |
|---|---|---|---|---|---|
| Liberal | Rt Hon. John Edward Bernard Seely | 10,204 | |||
| Conservative | Henry FitzHerbert Wright | 6,871 | |||
| Majority | |||||
| Turnout | |||||
| Liberal hold | Swing | ||||
| Party | Candidate | Votes | % | ± | |
|---|---|---|---|---|---|
| Liberal | Rt Hon. John Edward Bernard Seely | 9,990 | 62.7 | +2.9 | |
| Conservative | William Marshall Freeman | 5,946 | 37.3 | -2.9 | |
| Majority | 4,044 | 25.4 | +5.8 | ||
| Turnout | 81.9 | -5.8 | |||
| Liberal hold | Swing | +2.9 | |||
| Party | Candidate | Votes | % | ± | |
|---|---|---|---|---|---|
| Liberal | Rt Hon. John Edward Bernard Seely | 9,049 | 53.6 | -9.1 | |
| Unionist | William Marshall Freeman | 7,838 | 46.4 | +9.1 | |
| Majority | 1,211 | 7.2 | -18.2 | ||
| Turnout | 81.7 | -0.2 | |||
| Liberal hold | Swing | -9.1 | |||
General Election 1914/15:
Another General Election was required to take place before the end of 1915. The political parties had been making preparations for an election to take place and by the July 1914, the following candidates had been selected;
- Liberal: Rt Hon. John Edward Bernard Seely
- Unionist: William Marshall Freeman[23]
| Party | Candidate | Votes | % | ± | |
|---|---|---|---|---|---|
| Liberal | 9,660 | 54.8 | +1.2 | ||
| Labour | George Harold Oliver | 7,962 | 45.2 | n/a | |
| Majority | 1,698 | 9.6 | |||
| Turnout | 61.0 | -19.3 | |||
| Liberal hold | Swing | n/a | |||
- denotes candidate who was endorsed by the Coalition Government.
Elections in the 1920s
| Party | Candidate | Votes | % | ± | |
|---|---|---|---|---|---|
| Labour | George Harold Oliver | 9,432 | 40.0 | -5.2 | |
| National Liberal | Rt Hon. John Edward Bernard Seely | 8,348 | 35.3 | -19.6 | |
| Unionist | William Marshall Freeman | 5,841 | 24.7 | n/a | |
| Majority | 1,084 | 4.7 | 14.2 | ||
| Turnout | 76.8 | +15.8 | |||
| Labour gain from Liberal | Swing | +7.1 | |||

| Party | Candidate | Votes | % | ± | |
|---|---|---|---|---|---|
| Labour | George Harold Oliver | 9,191 | 42.1 | +2.1 | |
| Unionist | William Marshall Freeman | 6,566 | 30.0 | +5.3 | |
| Liberal | Thomas Worrall Casey | 6,112 | 27.9 | -7.4 | |
| Majority | 2,625 | 12.1 | +7.4 | ||
| Turnout | 69.4 | -7.4 | |||
| Labour hold | Swing | -1.6 | |||

| Party | Candidate | Votes | % | ± | |
|---|---|---|---|---|---|
| Labour | George Harold Oliver | 11,011 | 44.9 | +2.8 | |
| Unionist | Henry Victor Alpin MacKinnon Raikes | 9,203 | 37.5 | +7.5 | |
| Liberal | Hon. Lady Anna Barlow | 4,320 | 17.6 | -10.3 | |
| Majority | 1,808 | 7.4 | -4.7 | ||
| Turnout | 76.1 | +6.7 | |||
| Labour hold | Swing | -2.4 | |||
| Party | Candidate | Votes | % | ± | |
|---|---|---|---|---|---|
| Labour | George Harold Oliver | 20,202 | 59.0 | +14.1 | |
| Liberal | Dr John Vincent Shaw | 7,766 | 22.7 | +5.1 | |
| Unionist | Henry Victor Alpin MacKinnon Raikes | 6,258 | 18.3 | -19.2 | |
| Majority | 12,436 | 36.3 | +28.9 | ||
| Turnout | 80.7 | +3.9 | |||
| Labour hold | Swing | +4.5 | |||
Elections in the 1930s
| Party | Candidate | Votes | % | ± | |
|---|---|---|---|---|---|
| National Labour | Abraham John Flint | 17,587 | 50.0 | n/a | |
| Labour | George Harold Oliver | 17,585 | 50.0 | -9.0 | |
| Majority | 2 | 0.0 | 36.3 | ||
| Turnout | 79.7 | -1.0 | |||
| National Labour gain from Labour | Swing | ||||
| Party | Candidate | Votes | % | ± | |
|---|---|---|---|---|---|
| Labour | George Harold Oliver | 23,851 | 64.3 | +14.3 | |
| National | Sir Charles Markham | 13,250 | 35.7 | -14.3 | |
| Majority | 10,601 | 28.6 | 28.6 | ||
| Turnout | 81.7 | +2.0 | |||
| Labour gain from National Labour | Swing | +14.3 | |||
Elections in the 1940s
General Election 1939/40: Another General Election was required to take place before the end of 1940. The political parties had been making preparations for an election to take place from 1939 and by the end of this year, the following candidates had been selected;
- Labour: George Oliver
- Conservative:
- Liberal:
| Party | Candidate | Votes | % | ± | |
|---|---|---|---|---|---|
| Labour | George Harold Oliver | 26,536 | 66.8 | +2.5 | |
| Conservative | Fl-Lt. Philip G Hartley | 8,439 | 21.3 | n/a | |
| Liberal | Charles Orton Foster | 4,720 | 11.9 | n/a | |
| Majority | 18,097 | 45.6 | +17.0 | ||
| Turnout | 81.1 | -0.6 | |||
| Labour hold | Swing | n/a | |||
Elections in the 1950s
| Party | Candidate | Votes | % | ± | |
|---|---|---|---|---|---|
| Labour | George Harold Oliver | 39,495 | 64.9 | -1.9 | |
| Liberal | Geoffrey Eugene MacPherson | 11,262 | 18.5 | +6.6 | |
| Conservative | DFR Evans | 10,113 | 16.6 | -4.7 | |
| Majority | 28,233 | 46.4 | |||
| Turnout | 88.5 | ||||
| Labour hold | Swing | -4.3 | |||
| Party | Candidate | Votes | % | ± | |
|---|---|---|---|---|---|
| Labour | George Harold Oliver | 40,671 | 67.41 | ||
| Conservative | C Frank Baker | 10,273 | 17.03 | ||
| Liberal | Geoffrey Eugene MacPherson | 9,387 | 15.56 | ||
| Majority | 30,398 | 50.38 | |||
| Turnout | 60,331 | ||||
| Labour hold | Swing | ||||
| Party | Candidate | Votes | % | ± | |
|---|---|---|---|---|---|
| Labour | George Harold Oliver | 38,961 | 69.29 | ||
| Conservative | John Arnold Farr | 17,268 | 30.71 | ||
| Majority | 21,693 | 38.58 | |||
| Turnout | 80.37 | ||||
| Labour hold | Swing | ||||
| Party | Candidate | Votes | % | ± | |
|---|---|---|---|---|---|
| Labour | George Harold Oliver | 39,930 | 68.59 | ||
| Conservative | Gerald I Walters | 18,286 | 31.41 | ||
| Majority | 21,644 | 37.18 | |||
| Turnout | 83.50 | ||||
| Labour hold | Swing | ||||
Elections in the 1960s
| Party | Candidate | Votes | % | ± | |
|---|---|---|---|---|---|
| Labour | Leopold Raymond Fletcher | 33,924 | 60.2 | ||
| Conservative | Jeffery Nicholas Lewis Tillett | 13,542 | 24.0 | ||
| Liberal | Mrs. Peggy Edwards | 8,930 | 15.8 | n/a | |
| Majority | 20,382 | 36.2 | |||
| Turnout | 56,396 | ||||
| Labour hold | Swing | ||||
| Party | Candidate | Votes | % | ± | |
|---|---|---|---|---|---|
| Labour | Leopold Raymond Fletcher | 36,522 | 70.09 | ||
| Conservative | Basil J Eales | 15,582 | 29.91 | ||
| Majority | 20,940 | 40.19 | |||
| Turnout | 76.20 | ||||
| Labour hold | Swing | ||||
Elections in the 1970s
| Party | Candidate | Votes | % | ± | |
|---|---|---|---|---|---|
| Labour | Leopold Raymond Fletcher | 32,961 | 59.9 | ||
| Conservative | Richard Beardsley | 15,870 | 28.9 | ||
| Liberal | Wim Smit | 6,157 | 11.2 | n/a | |
| Majority | 17,091 | 31.0 | |||
| Turnout | 74.15 | ||||
| Labour hold | Swing | ||||
| Party | Candidate | Votes | % | ± | |
|---|---|---|---|---|---|
| Labour | Leopold Raymond Fletcher | 31,500 | 52.02 | ||
| Conservative | PM Morrell | 17,320 | 28.60 | ||
| Liberal | G Pool | 11,734 | 19.38 | n/a | |
| Majority | 14,180 | 23.42 | |||
| Turnout | 81.45 | ||||
| Labour hold | Swing | ||||
| Party | Candidate | Votes | % | ± | |
|---|---|---|---|---|---|
| Labour | Leopold Raymond Fletcher | 31,153 | 55.51 | ||
| Conservative | PM Morrell | 15,858 | 28.26 | ||
| Liberal | G Poole | 9,671 | 19.38 | n/a | |
| Majority | 14,180 | 28.26 | |||
| Turnout | 74.85 | ||||
| Labour hold | Swing | ||||
| Party | Candidate | Votes | % | ± | |
|---|---|---|---|---|---|
| Labour | Leopold Raymond Fletcher | 29,270 | 50.61 | ||
| Conservative | Michael Clark | 21,160 | 35.99 | ||
| Liberal | D Blackman | 7,879 | 13.40 | n/a | |
| Majority | 8,110 | 14.62 | |||
| Turnout | |||||
| Labour hold | Swing | ||||
See also
References
- ↑ "'Ilkeston', Feb 1974 - May 1983". ElectionWeb Project. Cognitive Computing Limited. Retrieved 23 March 2016.
- ↑ Liberal Year Book, 1907
- ↑ British Parliamentary Election Results 1885-1918, FWS Craig
- ↑ Liberal Year Book, 1907
- ↑ British Parliamentary Election Results 1885-1918, FWS Craig
- ↑ Liberal Year Book, 1907
- ↑ British Parliamentary Election Results 1885-1918, FWS Craig
- ↑ British Parliamentary Election Results 1885-1918, FWS Craig
- ↑ Liberal Year Book, 1907
- ↑ Debretts House of Commons & Judicial Bench, 1901
- ↑ Liberal Year Book, 1907
- ↑ British Parliamentary Election Results 1885-1918, FWS Craig
- ↑ Debretts House of Commons & Judicial Bench, 1901
- ↑ Liberal Year Book, 1907
- ↑ British Parliamentary Election Results 1885-1918, FWS Craig
- ↑ British Parliamentary Election Results 1885-1918, FWS Craig
- ↑ Liberal Year Book, 1907
- ↑ Debretts House of Commons & Judicial Bench, 1916
- ↑ British Parliamentary Election Results 1885-1918, FWS Craig
- ↑ Debretts House of Commons & Judicial Bench, 1916
- ↑ British Parliamentary Election Results 1885-1918, FWS Craig
- ↑ British parliamentary election results 1885-1918, FWS Craig
- ↑ Newcastle Journal 22 May 1914
- ↑ British Parliamentary Election Results 1918-1949, F W S Craig
- ↑ British Parliamentary Election Results 1918-1949, F W S Craig
- ↑ British Parliamentary Election Results 1918-1949, F W S Craig
- ↑ British Parliamentary Election Results 1918-1949, F W S Craig
- ↑ British Parliamentary Election Results 1918-1949, F W S Craig
- ↑ British Parliamentary Election Results 1918-1949, F W S Craig
- ↑ British Parliamentary Election Results 1918-1949, F W S Craig
- ↑ British Parliamentary Election Results 1918-1949, F W S Craig
- ↑ British parliamentary election results, 1950-1973 by FWS Craig
- ↑ British parliamentary election results, 1950-1973 by FWS Craig
- ↑ British parliamentary election results, 1950-1973 by FWS Craig
- ↑ British parliamentary election results, 1950-1973 by FWS Craig
- ↑ British parliamentary election results, 1950-1973 by FWS Craig
- ↑ British parliamentary election results, 1950-1973 by FWS Craig
- ↑ British parliamentary election results, 1950-1973 by FWS Craig
- ↑ British parliamentary election results, 1950-1979 by FWS Craig
Leigh Rayment's Historical List of MPs – Constituencies beginning with "I"