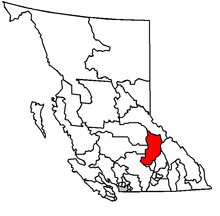
Kamloops-North Thompson
Kamloops-North Thompson is a provincial electoral district for the Legislative Assembly of British Columbia, Canada.
Demographics
| Population |
48,482 |
| Population Change, 1996–2001 |
1.6% |
| Area (km²) |
21,224.16 |
| Pop. Density |
2.3 |
Election results
| B.C. General Election 2005: Kamloops-North Thompson |
| Party |
Candidate |
Votes |
% |
± |
Expenditures |
|
Liberal | Kevin Krueger | 11,648 | 48.36% | – | $114,377 |
| |
NDP |
Mike Hanson |
9,635 |
40.00% |
|
$70,259 |
|
Green | Grant Fraser | 1,689 | 7.01% | – | $2,268 |
|
Conservative | Bob Altenhofen | 795 | 3.30% | | $1,511 |
|
Marijuana | Keenan Todd | 321 | 1.33% | | $100 |
| Total Valid Votes |
24,088 |
100% |
| Total Rejected Ballots |
150 |
0.62% |
| Turnout |
24,238 |
67.71% |
| B.C. General Election 2001: Kamloops-North Thompson |
| Party |
Candidate |
Votes |
% |
± |
Expenditures |
|
Liberal | Kevin Krueger | 12,676 | 58.04% | – | $46,310 |
| |
NDP |
Dwayne Hartle |
4,181 |
19.14% |
|
$24,205 |
|
Green | Denis J. Walsh | 3,122 | 14.29% | – | $4,398 |
|
Marijuana | Vern Falk | 1,025 | 4.69% | | $3,765 |
|
Unity | R.H. (Bob) Altenhofen | 836 | 3.84% | – | $5,587 |
| Total valid votes |
21,840 | 100.00% |
| Total rejected ballots |
172 | 0.79% |
| Turnout |
22,012 | 72.65% |
| B.C. General Election 1996: Kamloops-North Thompson |
| Party |
Candidate |
Votes |
% |
± |
Expenditures |
|
Liberal | Kevin Krueger | 7,313 | 43.43% | – | $54,922 |
| |
NDP |
Frederick H. Jackson |
6,945 |
41.25% |
|
$24,546 |
|
Reform | Alan Forseth | 1,710 | 10.16% | – | $9,123 |
|
Social Credit | Steve Quinn | 468 | 2.78% | – | $6,908 |
|
Green | Alan Child | 401 | 2.38% | – | $295 |
| Total valid votes |
16,837 | 100.00% |
| Total rejected ballots |
118 | 0.70% |
| Turnout |
16,955 | 72.65% |
| B.C. General Election 1991: Kamloops-North Thompson |
| Party |
Candidate |
Votes |
% |
± |
Expenditures |
| |
NDP |
Frederick H. Jackson |
5,843 |
39.43% |
|
$27,214 |
|
Social Credit | Paul Caissie | 4,283 | 28.90% | – | $44,425 |
|
Liberal | John E. Harwood | 4,694 | 31.67% | – | $2,650 |
| Total valid votes |
14,820 | 100.00% |
| Total rejected ballots |
227 | 1.51% |
| Turnout |
15,047 | 74.02% |
External links
|
|---|
|
| North / Central | |
|---|
|
| Southern Interior | |
|---|
|
| Fraser Valley / South LM | |
|---|
|
| Vancouver / North LM | |
|---|
|
| Vancouver Island | |
|---|
|
| See also: | |
|---|
|
|---|
|
| North / Central | |
|---|
|
| Southern Interior | |
|---|
|
| Fraser Valley / South LM | |
|---|
|
| Vancouver / North LM | |
|---|
|
| Vancouver Island / South Coast | |
|---|
|
| See also: | |
|---|
|
|---|
|
| North / Central | |
|---|
|
| Southern Interior | |
|---|
|
| Fraser Valley / South LM | |
|---|
|
| Vancouver / North LM | |
|---|
|
| Vancouver Island / South Coast | |
|---|
|
| See also: | |
|---|
