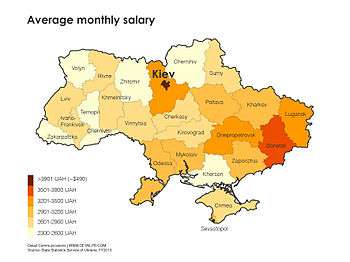
List of Ukrainian oblasts and territories by salary

Average monthly salary in Ukraine for the full year of 2013.
| Region | Region Rank 2007 | Average Monthly Wage (UAH) December, 2009 | Average Monthly Wage (UAH) July, 2013 | Average Monthly Wage (UAH) , FY2013 |
|---|---|---|---|---|
| Autonomous Republic of Crimea (annexed by Russia) | 10 | 2,027 | 2,991 | 2,878 |
| Cherkasy Oblast | 16 | 1,768 | 2,868 | 2,689 |
| Chernihiv Oblast | 26 | 1,636 | 2,656 | 2,510 |
| Chernivtsi Oblast | 22 | 1,816 | 2,635 | 2,487 |
| Dnipropetrovsk Oblast | 3 | 2,233 | 3,459 | 3,337 |
| Donetsk Oblast | 2 | 2,436 | 3,901 | 3,762 |
| Ivano-Frankivsk Oblast | 13 | 1,808 | 2,901 | 2,690 |
| Kharkiv Oblast | 8 | 2,130 | 3,122 | 2,980 |
| Kherson Oblast | 25 | 1,744 | 2,593 | 2,474 |
| Khmelnytskyi Oblast | 17 | 1,807 | 2,816 | 2,645 |
| Kyiv City | 1 | 3,684 | 5,238 | 5,024 |
| Kiev Oblast | 4 | 2,322 | 3,474 | 3,369 |
| Kirovohrad Oblast | 21 | 1,833 | 2,809 | 2,613 |
| Luhansk Oblast | 7 | 2,142 | 3,497 | 3,342 |
| Lviv Oblast | 14 | 1,944 | 2,962 | 2,791 |
| Mykolaiv Oblast | 12 | 2,174 | 3,242 | 3,106 |
| Odessa Oblast | 11 | 2,317 | 3,041 | 2,906 |
| Poltava Oblast | 9 | 2,053 | 3,182 | 2,993 |
| Rivne Oblast | 15 | 1,984 | 3,026 | 2,847 |
| Sevastopol City | 6 | 2,328 | 3,110 | 3,119 |
| Sumy Oblast | 20 | 1,857 | 2,925 | 2,706 |
| Ternopil Oblast | 27 | 1,695 | 2,505 | 2,367 |
| Vinnytsia Oblast | 23 | 1,784 | 2,885 | 2,656 |
| Volyn Oblast | 24 | 1,654 | 2,788 | 2,584 |
| Zakarpattia Oblast | 18 | 1,915 | 2,729 | 2,559 |
| Zaporizhia Oblast | 5 | 2,105 | 3,287 | 3,148 |
| Zhytomyr Oblast | 19 | 1,787 | 2,760 | 2,571 |
| Ukraine | ... | 2,233 | 3,429 | 3,274 |
See also
- Pensions in Ukraine
- Unemployment benefits in Ukraine
- List of Ukrainian administrative divisions by GRP per capita (in $US)
References
- Average wage by regions in 2009. State Statistics Committee of Ukraine
- Average wage by regions in 2013. State Statistics Committee of Ukraine
| ||||||||||||||||||||||||||||||||||||||||||||||||
This article is issued from Wikipedia - version of the 8/17/2015. The text is available under the Creative Commons Attribution/Share Alike but additional terms may apply for the media files.