List of VFL/AFL records
This is a list of records from the Australian Football League since its inception as the Victorian Football League in 1897.
Team records
Team wins, losses and draws
| Team | Matches | Won | Drawn | Lost | GF-BF | % | For | GA-BA | % | Agn | % |
Win% |
|---|---|---|---|---|---|---|---|---|---|---|---|---|
| Adelaide | 555 | 290 | 1 | 264 | 7598.6952 | 52.2 | 52540 | 7230.6373 | 53.2 | 49753 | 105.6 | 52.34 |
| Brisbane Bears † | 222 | 72 | 2 | 148 | 2852.2606 | 52.3 | 19718 | 3521.3259 | 51.9 | 24385 | 80.86 | 32.88 |
| Brisbane Lions | 417 | 209 | 6 | 202 | 5791.5255 | 52.4 | 40001 | 5620.5097 | 52.4 | 38817 | 103.05 | 50.84 |
| Carlton | 2403 | 1404 | 34 | 965 | 29393.31005 | 48.7 | 207363 | 26537.28721 | 48 | 187943 | 110.33 | 59.13 |
| Collingwood | 2441 | 1485 | 26 | 930 | 30131.32 | 48.5 | 212786 | 26601.28807 | 48 | 188413 | 112.94 | 61.37 |
| Essendon | 2367 | 1341 | 35 | 991 | 29377.30078 | 49.4 | 206340 | 26861.28428 | 48.6 | 189594 | 108.83 | 57.39 |
| Fitzroy † | 1928 | 869 | 25 | 1034 | 21102.23701 | 47.1 | 150313 | 22350.24426 | 47.8 | 158526 | 94.82 | 45.72 |
| Fremantle | 453 | 202 | 1 | 250 | 5812.5194 | 52.8 | 40066 | 6209.5403 | 53.5 | 42657 | 93.93 | 44.7 |
| Geelong | 2336 | 1260 | 21 | 1055 | 28625.29528 | 49.2 | 201278 | 26737.28184 | 48.7 | 188606 | 106.72 | 54.39 |
| Gold Coast | 100 | 24 | 1 | 64 | 983.98 | 50.1 | 6878 | 1360.1183 | 53.5 | 9343 | 73.62 | 27.27 |
| Greater Western Sydney | 66 | 9 | 0 | 57 | 659.62 | 51.5 | 4574 | 1188.933 | 56 | 8061 | 56.74 | 13.64 |
| Hawthorn | 1880 | 911 | 10 | 959 | 24369.23764 | 50.6 | 169978 | 24106.24495 | 49.6 | 169131 | 100.5 | 48.72 |
| Melbourne | 2308 | 1040 | 21 | 1247 | 26681.27947 | 48.8 | 188033 | 28144.29144 | 49.1 | 198008 | 94.96 | 45.52 |
| North Melbourne | 1872 | 829 | 17 | 1026 | 23568.23272 | 50.3 | 164680 | 25056.24701 | 50.4 | 175037 | 94.08 | 44.74 |
| Port Adelaide | 418 | 212 | 5 | 201 | 5617.5033 | 52.7 | 38735 | 5661.4942 | 53.4 | 38908 | 99.56 | 51.32 |
| Richmond | 2161 | 1085 | 22 | 1054 | 26901.27915 | 49.1 | 189321 | 26978.27532 | 49.5 | 189400 | 99.96 | 50.72 |
| St Kilda | 2284 | 886 | 25 | 1373 | 25048.26488 | 48.6 | 176776 | 28347.29475 | 49 | 199557 | 88.58 | 39.34 |
| Sydney | 2333 | 1096 | 24 | 1213 | 27125.289 | 48.4 | 191650 | 27798.29235 | 48.7 | 196023 | 97.77 | 47.49 |
| University † | 126 | 27 | 2 | 97 | 841.1135 | 42.6 | 6181 | 1245.1597 | 43.8 | 9067 | 68.17 | 22.22 |
| West Coast | 657 | 359 | 5 | 293 | 9038.8278 | 52.2 | 62506 | 8567.756 | 53.1 | 58962 | 106.01 | 55.02 |
| Western Bulldogs | 1845 | 818 | 22 | 1005 | 22370.22543 | 49.8 | 156763 | 23765.23699 | 50.1 | 166289 | 94.27 | 44.93 |
Source: AFL Tables. Last updated: 21 February 2015
Highest and Lowest scores
| Highest | ||||||
|---|---|---|---|---|---|---|
| Rank | Score | Club | Opponent | Year | Round | Venue |
| 1 | 37.17.239 | Geelong | Brisbane Bears | 1992 | 7 | Carrara Stadium |
| 2 | 36.22.238 | Fitzroy | Melbourne | 1979 | 17 | VFL Park |
| 3 | 36.20.236 | Sydney | Essendon | 1987 | 17 | Sydney Cricket Ground |
| 4 | 37.11.233 | Geelong | Melbourne | 2011 | 19 | Kardinia Park |
| 5 | 36.15.231 | Hawthorn | Fitzroy | 1991 | 6 | North Hobart Oval |
| Source: . Last updated: 20 August 2013. | ||||||
| Lowest | ||||||
|---|---|---|---|---|---|---|
| Rank | Score | Club | Opponent | Year | Round | Venue |
| 1 | 0.1.1 | St Kilda | Geelong | 1899 | 3 (FS) | Corio Oval |
| 2 | 0.2.2 | St Kilda | South Melbourne | 1897 | 3 | Lake Oval |
| 0.2.2 | St Kilda | Geelong | 1899 | 14 | Corio Oval | |
| 0.2.2 | Melbourne | Fitzroy | 1899 | 2 (FS) | Brunswick Street Oval | |
| 5 | 0.3.3 | St Kilda | South Melbourne | 1897 | 10 | Junction Oval |
| 0.3.3 | St Kilda | Essendon | 1897 | 12 | East Melbourne Cricket Ground | |
| Source: . Last updated: 20 August 2013. (FS) = Sectional Round in Finals | ||||||
All these scores were from the first three years of VFL competition, when scores in general were much lower. The following table shows the lowest scores since 1919 (the first year of complete competition following World War I).
| Lowest since 1919 | ||||||
|---|---|---|---|---|---|---|
| Rank | Score | Club | Opponent | Year | Round | Venue |
| 1 | 1.0.6 | Fitzroy | Footscray | 1953 | 5 | Western Oval |
| 2 | 0.8.8 | Richmond | St Kilda | 1961 | 16 | Junction Oval |
| 3 | 1.5.11 | St Kilda | Melbourne | 1957 | 16 | Junction Oval |
| 4 | 1.7.13 | Hawthorn | Melbourne | 1926 | 9 | Melbourne Cricket Ground |
| 1.7.13 | Richmond | Collingwood | 1927 | GF | Melbourne Cricket Ground | |
| 1.7.13 | Fremantle | Adelaide | 2009 | 15 | Football Park | |
| Source: . Last updated: 20 August 2013. | ||||||
Highest losing scores and lowest winning scores
| Highest losing scores | |||||||
|---|---|---|---|---|---|---|---|
| Rank | Score | Club | Opponent | Opponent’s score | Year | Round | Venue |
| 1 | 25.13.163 | Geelong | Hawthorn | 26.15.171 | 1989 | 6 | Princes Park |
| 2 | 25.9.159 | Kangaroos | Essendon | 27.9.171 | 2001 | 16 | Melbourne Cricket Ground |
| 3 | 23.19.157 | Fitzroy | Melbourne | 24.23.167 | 1978 | 2 | Melbourne Cricket Ground |
| 4 | 24.11.155 | South Melbourne | Geelong | 26.11.167 | 1978 | 19 | Lake Oval |
| 5 | 24.10.154 | South Melbourne | Melbourne | 24.23.167 | 1979 | 6 | Melbourne Cricket Ground |
| Source: . Last updated: 20 August 2013. | |||||||
| Lowest winning scores | |||||||
|---|---|---|---|---|---|---|---|
| Rank | Score | Club | Opponent | Opponent’s score | Year | Round | Venue |
| 1 | 1.8.14 | Essendon | Melbourne | 0.8.8 | 1897 | 3 (Finals) | East Melbourne Cricket Ground |
| 2 | 1.9.15 | Geelong | Melbourne | 0.10.10 | 1897 | 9 | Corio Oval |
| 2.3.15 | South Melbourne | Melbourne | 1.7.13 | 1898 | 6 | Melbourne Cricket Ground | |
| 1.9.15 | Essendon | South Melbourne | 0.9.9 | 1899 | 3 | East Melbourne Cricket Ground | |
| 5 | 1.13.19 | Essendon | South Melbourne | 2.3.15 | 1897 | 6 | Lake Oval |
| Source: . Last updated: 20 August 2013 | |||||||
As with the lowest overall scores, all these were from the first three years of the VFL. The lowest winning scores in more recent times are:
| Lowest winning scores since 1919 | |||||||
|---|---|---|---|---|---|---|---|
| Rank | Score | Club | Opponent | Opponent’s score | Year | Round | Venue |
| 1 | 2.13.25 | Collingwood | Richmond | 1.7.13 | 1927 | GF | Melbourne Cricket Ground |
| 2 | 3.10.28 | Essendon | Footscray | 3.5.23 | 1989 | 13 | Windy Hill |
| 3 | 4.6.30 | Carlton | Richmond | 3.5.23 | 1927 | 17 | Princes Park |
| 4 | 3.13.31 | Collingwood | Essendon | 4.6.30 | 1927 | 17 | Victoria Park |
| 4.7.31 | Collingwood | Geelong | 3.11.29 | 1951 | 14 | Kardinia Park | |
| 3.13.31 | Carlton | Geelong | 2.12.24 | 1977 | 12 | Princes Park | |
| Source: . Last updated: 20 August 2013. | |||||||
Highest scores for each quarter
| Quarter | Score | Club | Opponent | Year | Round | Venue |
|---|---|---|---|---|---|---|
| 1st | 15.4.94 | Essendon | Gold Coast | 2011 | 6 | Docklands Stadium |
| 2nd | 14.2.86 | Adelaide | Fitzroy | 1996 | 17 | Football Park |
| 3rd | 13.4.82 | Essendon | Footscray | 1982 | 22 | Western Oval |
| 4th | 17.4.106 | South Melbourne | St Kilda | 1919 | 12 | Lake Oval |
| Source: . Last updated: 20 August 2013. | ||||||
Greatest winning margins
| Rank | Margin | Club | Opponent | Year | Round | Venue |
|---|---|---|---|---|---|---|
| 1 | 190 | Fitzroy | Melbourne | 1979 | 17 | VFL Park |
| 2 | 186 | Geelong | Melbourne | 2011 | 19 | Kardinia Park |
| 3 | 178 | Collingwood | St Kilda | 1979 | 4 | Victoria Park |
| 4 | 171 | South Melbourne | St Kilda | 1919 | 12 | Lake Oval |
| 5 | 168 | Richmond | North Melbourne | 1931 | 2 | Punt Road Oval |
| Source: . Last updated: 20 August 2013. | ||||||
Biggest comebacks
Deficit from end of 1/4 time
| Rank | Deficit | Club | Final Score | Opponent | Final Score | Year | Round | Venue |
|---|---|---|---|---|---|---|---|---|
| 1 | 58 | Essendon | 27.9.171 | Kangaroos | 25.9.159 | 2001 | 16 | Melbourne Cricket Ground |
| 2 | 55 | St Kilda | 15.22.112 | Hawthorn | 14.15.99 | 1937 | 2 | Glenferrie Oval |
| 3 | 51 | Hawthorn | 17.7.109 | St Kilda | 14.12.96 | 1999 | 12 | Waverley Park |
| 4 | 48 | Richmond | 19.13.127 | Sydney Swans | 16.14.110 | 1982 | 21 | Sydney Cricket Ground |
| 48 | West Coast Eagles | 16.17.113 | Western Bulldogs | 15.10.100 | 1998 | 10 | WACA Ground | |
| Source: http://afl.allthestats.com/?itm=211134&fmqtr=0. Last updated: 14 January 2011. | ||||||||
Deficit from end of 1/2 time
| Rank | Deficit | Club | Final Score | Opponent | Final Score | Year | Round | Venue |
|---|---|---|---|---|---|---|---|---|
| 1 | 52 | Collingwood | 14.23.107 | St Kilda | 15.10.100 | 1970 | 10 | Victoria Park |
| 2 | 50 | Melbourne | 17.17.119 | Fremantle | 15.23.113 | 2008 | 7 | Melbourne Cricket Ground |
| 3 | 49 | Geelong | 17.10.112 | Collingwood | 17.9.111 | 1972 | 20 | Kardinia Park |
| 49 | Hawthorn | 26.15.171 | Geelong | 25.13.163 | 1989 | 6 | Princes Park | |
| 49 | St Kilda | 14.10.94 | Western Bulldogs | 13.9.87 | 2015 | 6 | Docklands Stadium | |
| Source: http://afl.allthestats.com/?itm=211134&fmqtr=1. Last updated: 14 January 2011. | ||||||||
Deficit from end of 3/4 time
| Rank | Deficit | Club | Final Score | Opponent | Final Score | Year | Round | Venue |
|---|---|---|---|---|---|---|---|---|
| 1 | 45 | Brisbane Bears | 14.20.104 | Hawthorn | 14.13.97 | 1995 | 16 | The Gabba |
| 2 | 44 | North Melbourne | 15.12.102 | Essendon | 14.10.94 | 1947 | 6 | Arden Street Oval |
| 3 | 41 | North Melbourne | 12.19.91 | Footscray | 13.7.85 | 1936 | 7 | Arden Street Oval |
| 41 | Essendon | 18.16.124 | Melbourne | 19.9.123 | 1992 | 6 | Melbourne Cricket Ground | |
| 5 | 40 | Western Bulldogs | 14.15.99 | Adelaide | 14.13.97 | 1999 | 16 | Melbourne Cricket Ground |
| 40 | Kangaroos | 17.16.118 | Sydney Swans | 18.4.112 | 2004 | 19 | Sydney Cricket Ground | |
Largest comebacks (from any stage of the game)
| Rank | Deficit | Club | Final Score | Opponent | Final Score | Year | Round | Venue |
|---|---|---|---|---|---|---|---|---|
| 1 | 69pts Q2 10mins | Essendon | 27.9.171 | North Melbourne | 25.9.159 | 2001 | 16 | MCG |
| 2 | 63pts Q2 5mins | Hawthorn | 17.7.109 | St Kilda | 14.12.96 | 1999 | 12 | Waverley Park |
| 3 | 60pts Q2 27mins | Collingwood | 14.23.107 | St Kilda | 15.10.100 | 1970 | 10 | Victoria Park |
| 4 | 56pts Q2 28mins | Hawthorn | 26.15.171 | Geelong | 25.13.163 | 1989 | 6 | Princes Park |
| 5 | 55pts at Q1 time | St Kilda | 15.22.112 | Hawthorn | 14.15.99 | 1937 | 2 | Glenferrie Oval |
| 55pts Q2 10mins | Collingwood | 19.9.123 | Richmond | 16.13.109 | 1978 | 20 | Punt Road Oval | |
| 55pts Q3 3mins | St Kilda | 14.10.94 | Western Bulldogs | 13.9.87 | 2015 | 6 | Docklands Stadium | |
Highest scores (both teams)
| Rank | Score | Home Team | Score | Away Team | Score | Year | Round | Venue |
|---|---|---|---|---|---|---|---|---|
| 1 | 52.33.345 | Melbourne | 21.15.141 | St Kilda | 31.18.204 | 1978 | 6 | Melbourne Cricket Ground |
| =2 | 51.31.337 | Geelong | 35.18.228 | St Kilda | 16.13.109 | 1989 | 7 | Kardinia Park |
| =2 | 50.37.337 | Hawthorn | 21.23.149 | Richmond | 29.14.188 | 1985 | 5 | Princes Park |
| =4 | 51.28.334 | Kangaroos | 35.19.229 | Sydney | 16.9.105 | 1993 | 6 | Princes Park |
| =4 | 51.28.334 | Hawthorn | 26.15.171 | Geelong | 25.13.163 | 1989 | 6 | Princes Park |
| Source: . | ||||||||
Individual records
Disposals
| Rank | Player | Disposals | Year vs Team |
|---|---|---|---|
| =1 | Greg Williams | 53 | 1989 vs St Kilda |
| =1 | Gary Ablett | 53 | 2012 vs Collingwood |
| 3 | Barry Price | 52 | 1971 vs Fitzroy |
| 4 | Scott Thompson | 51 | 2011 vs Gold Coast |
| =5 | John Greening | 50 | 1971 vs Geelong |
| =5 | Tony Shaw | 50 | 1991 vs Brisbane Bears |
Goalkicking
Most career goals
- For a larger list see List of VFL/AFL players to have scored 500 goals.
| Rank | Goals | Games | Player | Club/Clubs | Career |
|---|---|---|---|---|---|
| 1 | 1360 | 281 | Tony Lockett | St Kilda, Sydney | 1983–1999, 2002 |
| 2 | 1299 | 306 | Gordon Coventry | Collingwood | 1920–1937 |
| 3 | 1254 | 269 | Jason Dunstall | Hawthorn | 1985–1998 |
| 4 | 1057 | 267 | Doug Wade | Geelong, North Melbourne | 1959–1975 |
| 5 | 1030 | 248 | Gary Ablett, Sr. | Hawthorn, Geelong | 1982–1996 |
| Source: . Last updated: 10 June 2009. | |||||
Most goals in a game
Fred Fanning
| Rank | Score | Player | Club | Opponent | Year | Round | Venue |
|---|---|---|---|---|---|---|---|
| 1 | 18.1 | Fred Fanning | Melbourne | St Kilda | 1947 | 19 | Junction Oval |
| 2 | 17.4 | Gordon Coventry | Collingwood | Fitzroy | 1930 | 12 | Victoria Park |
| 17.5 | Jason Dunstall | Hawthorn | Richmond | 1992 | 7 | Waverley Park | |
| 4 | 16.5 | Gordon Coventry | Collingwood | Hawthorn | 1929 | 13 | Victoria Park |
| 16.1 | Peter Hudson | Hawthorn | Melbourne | 1969 | 5 | Glenferrie Oval | |
| 16.4 | Peter McKenna | Collingwood | South Melbourne | 1969 | 19 | Victoria Park | |
| 16.0 | Tony Lockett | Sydney Swans | Fitzroy | 1995 | 19 | Whitten Oval | |
| Source: . Last updated: 14 January 2011. | |||||||
Most goals in a season
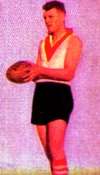
Bob Pratt
| Rank | Goals | Player | Club | Season | ||
|---|---|---|---|---|---|---|
| 1 | 150 | Bob Pratt | South Melbourne | 1934 | ||
| 150 | Peter Hudson | Hawthorn | 1971 | |||
| 3 | 146 | Peter Hudson | Hawthorn | 1970 | ||
| 4 | 145 | Jason Dunstall | Hawthorn | 1992 | ||
| 5 | 143 | Peter McKenna | Collingwood | 1970 | ||
| Source: . Last updated: 9 July 2007. | ||||||
Most seasons as leading goalkicker
- For season by season list see Coleman Medal.
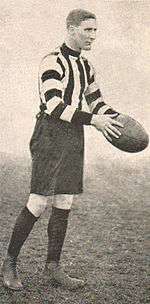
Dick Lee
| Rank | Seasons | Player | Club/Clubs | |||
|---|---|---|---|---|---|---|
| 1 | 8 | Dick Lee | Collingwood | |||
| 2 | 6 | Gordon Coventry | Collingwood | |||
| 3 | 5 | John Coleman | Essendon | |||
| 4 | 4 | Fred Fanning | Melbourne | |||
| 4 | Doug Wade | Geelong, North Melbourne | ||||
| 4 | Peter Hudson | Hawthorn | ||||
| 4 | Tony Lockett | St Kilda, Sydney | ||||
| Source: . Last updated: 20 May 2009. Note: This table does not take into account goals scored in finals. | ||||||
Highest goals per game average
| Rank | Average | Player | Club/Clubs | |||
|---|---|---|---|---|---|---|
| 1 | 5.64 | Peter Hudson | Hawthorn | |||
| 2 | 5.48 | John Coleman | Essendon | |||
| 3 | 4.84 | Tony Lockett | St Kilda, Sydney | |||
| 4 | 4.66 | Jason Dunstall | Hawthorn | |||
| 5 | 4.58 | Peter McKenna | Collingwood, Carlton | |||
| Source: . Last updated: 9 July 2007. | ||||||
Most goals on debut
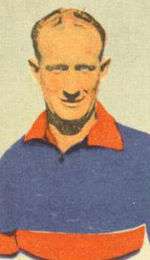
Bill Wood
| Rank | Goals | Player | Club | Opponent | Year | Round | Venue |
|---|---|---|---|---|---|---|---|
| 1 | 12 | John Coleman | Essendon | Hawthorn | 1949 | 1 | Windy Hill |
| 2 | 9 | Bill Wood | Footscray | Collingwood | 1944 | 3 | Whitten Oval |
| 9 | Warren Ralph | Carlton | North Melbourne | 1984 | 1 | Waverley Park | |
| 4 | 8 | John Georgiades | Footscray | Carlton | 1989 | 1 | Princes Park |
| 8 | Scott Cummings | Essendon | Sydney Swans | 1994 | 14 | Melbourne Cricket Ground | |
| Source: Official statistical history of the AFL (book). Last updated: 2007. | |||||||
Most consecutive games with one or more goals
| Rank | Streak | Player | Club/s | Start | End |
|---|---|---|---|---|---|
| 1 | 121 | Peter McKenna | Collingwood | 1968 | 1974 |
| 2 | 114 | Tony Lockett | St Kilda, Sydney | 1993 | 2002 |
| 3 | 98 | Gordon Coventry | Collingwood | 1932 | 1937 |
| 4 | 97 | Dick Lee | Collingwood | 1910 | 1918 |
| 5 | 90 | Doug Wade | Geelong, North Melbourne | 1971 | 1975 |
| Source: AFL Tables. Last updated: 13 July 2015. | |||||
Most career games for no goals
| Rank | Games | Player | Club/Clubs | |||
|---|---|---|---|---|---|---|
| 1 | 182 | Ted Potter | Collingwood | |||
| 2 | 172 | Gary Malarkey | Geelong | |||
| 3 | 166 | Les Gardiner | Essendon | |||
| 4 | 162 | Jamie Shanahan | St Kilda, Melbourne | |||
| 5 | 154 | Ian Synman | St Kilda | |||
| Source: AFL Tables. Last updated: 9 July 2007. | ||||||
Games
Most career games
- For a larger list see List of VFL/AFL players to have played 300 games.
| Rank | Games | Player | Club/Clubs | Career span |
|---|---|---|---|---|
| 1 | 432 | Brent Harvey | North Melbourne | 1996–2016 |
| 2 | 426 | Michael Tuck | Hawthorn | 1972–1991 |
| 3 | 403 | Kevin Bartlett | Richmond | 1965–1983 |
| 4 | 400 | Dustin Fletcher | Essendon | 1993–2015 |
| 5 | 383 | Robert Harvey | St Kilda | 1988–2008 |
Most consecutive games
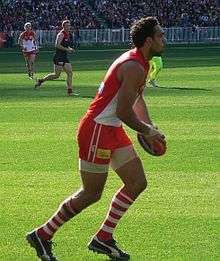
Adam Goodes
| Rank | Games | Player | Club/Clubs |
|---|---|---|---|
| 1 | 244 | Jim Stynes | Melbourne |
| 2 | 226 | Adem Yze | Melbourne |
| 3 | 204 | Adam Goodes | Sydney |
| 4 | 202 | Jack Titus | Richmond |
| 5 | 200 | Brett Kirk | Sydney |
Most games for each club
- For a larger list see Australian rules footballers with 200 games for one club.

Brad Johnson
| Club | Games | Player | Career span | |||
|---|---|---|---|---|---|---|
| Adelaide | 340 | Andrew McLeod | 1995-2010 | |||
| Brisbane Bears | 164 | Roger Merrett | 1988-1996 | |||
| Brisbane Lions | 322 | Simon Black | 1998-2013 | |||
| Carlton | 375 | Craig Bradley | 1986-2002 | |||
| Collingwood | 313 | Tony Shaw | 1977-1994 | |||
| Essendon | 400 | Dustin Fletcher | 1993–2015 | |||
| Fitzroy | 333 | Kevin Murray | 1955-1964, 1967-1974 | |||
| Footscray/Western Bulldogs | 364 | Brad Johnson | 1994-2010 | |||
| Fremantle | 353 | Matthew Pavlich | 2000–2016 | |||
| Geelong | 332 | Corey Enright | 2001-2016 | |||
| Gold Coast | 114 | Jarrod Harbrow | 2011–present | |||
| Greater Western Sydney | 107 | Callan Ward | 2012–present | |||
| Hawthorn | 426 | Michael Tuck | 1972-1991 | |||
| Melbourne | 306 | David Neitz | 1993-2008 | |||
| North Melbourne | 432 | Brent Harvey | 1996–2016 | |||
| Port Adelaide | 300 | Kane Cornes | 2001-2015 | |||
| Richmond | 403 | Kevin Bartlett | 1965-1983 | |||
| St Kilda | 383 | Robert Harvey | 1988-2008 | |||
| South Melbourne/Sydney | 372 | Adam Goodes | 1999–2015 | |||
| University | 101 | Bert Hurrey | 1908-1913 | |||
| West Coast | 290 | Dean Cox | 2000-2014 | |||
| Source: . Last updated: 11 Sept 2016. | ||||||
Age records
Youngest players
Age on their debut
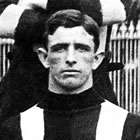
Wels Eicke
| Rank | Age | Player | Club | Year | ||
|---|---|---|---|---|---|---|
| 1 | 15 years, 209 days | Claude Clough | St Kilda | 1900 | ||
| 2 | 15 years, 287 days | Keith Bromage | Collingwood | 1953 | ||
| 3 | 15 years, 297 days | Albert Collier | Collingwood | 1925 | ||
| 4 | 15 years, 305 days | Tim Watson | Essendon | 1977 | ||
| 5 | 15 years, 315 days | Wels Eicke | St Kilda | 1909 | ||
| Source: Official statistical history of the AFL (book) Australian Football.com Last updated: 2013 | ||||||
Oldest players
Age in their last game
Jack Leith
| Rank | Age | Player | Club | Year |
|---|---|---|---|---|
| 1 | 43 years, 50 days | Vic Cumberland | St Kilda | 1920 |
| 2 | 40 years, 23 days | Dustin Fletcher | Essendon | 2015 |
| 3 | 39 years, 296 days | Jack Leith | Melbourne | 1912 |
| 4 | 39 years, 239 days | Syd Barker, Sr. | North Melbourne | 1927 |
| 5 | 39 years, 181 days | Jim Flynn | Carlton | 1910 |
| Source: . Last updated: 31 May 2015. | ||||
Finals
Most premierships
Harry Collier
| Rank | Total | Player | Club | |||
|---|---|---|---|---|---|---|
| 1 | 7 | Michael Tuck | Hawthorn | |||
| 2 | 6 | Frank Adams | Melbourne | |||
| 6 | Ron Barassi | Melbourne | ||||
| 6 | Albert Collier | Collingwood | ||||
| 6 | Harry Collier | Collingwood | ||||
| Source: Official statistical history of the AFL (book). Last updated: 2007. | ||||||
Most Grand Final appearances
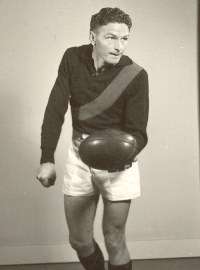
Bill Hutchison
| Rank | Games | Player | Club | |||
|---|---|---|---|---|---|---|
| 1 | 11 | Michael Tuck | Hawthorn | |||
| 2 | 10 | Gordon Coventry | Collingwood | |||
| 10 | Albert Collier | Collingwood | ||||
| 10 | Dick Reynolds | Essendon | ||||
| 10 | Bill Hutchison | Essendon | ||||
| Source: AFL Tables Last updated: 5 July 2015. | ||||||
Most finals games
| Rank | Games | Player | Club | ||
|---|---|---|---|---|---|
| 1 | 39 | Michael Tuck | Hawthorn | ||
| 2 | 33 | Shaun Burgoyne | Port Adelaide (14) Hawthorn (19) | ||
| 3 | 31 | Gordon Coventry | Collingwood | ||
| 4 | 29 | Leigh Matthews | Hawthorn | ||
| 29 | Wayne Schimmelbusch | North Melbourne | |||
| 29 | Bruce Doull | Carlton | |||
| Source: AFL Tables Last updated: 10 September 2016. | |||||
Most finals goals
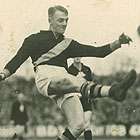
Jack Titus
| Rank | Total | Player | Club | |||
|---|---|---|---|---|---|---|
| 1 | 112 | Gordon Coventry | Collingwood | |||
| 2 | 78 | Jason Dunstall | Hawthorn | |||
| 3 | 74 | Jack Titus | Richmond | |||
| 4 | 72 | Leigh Matthews | Hawthorn | |||
| 5 | 65 | Stephen Kernahan | Carlton | |||
| Lance Franklin | Hawthorn / Sydney | |||||
| Last updated: 2016. | ||||||
Coaching
Most games coached
| Rank | Total | Player | Club/Clubs | |||
|---|---|---|---|---|---|---|
| 1 | 718 | Mick Malthouse | Footscray, West Coast, Collingwood, Carlton | |||
| 2 | 714 | Jock McHale | Collingwood | |||
| 3 | 678 | Kevin Sheedy | Essendon, Greater Western Sydney | |||
| 4 | 575 | Allan Jeans | St Kilda, Hawthorn, Richmond | |||
| 5 | 522 | Tom Hafey | Richmond, Collingwood, Geelong, Sydney | |||
| Source: . Last updated: 31 May 2015. | ||||||
Most wins as coach
| Rank | Total | Player | Club/Clubs | |||
|---|---|---|---|---|---|---|
| 1 | 467 | Jock McHale | Collingwood | |||
| 2 | 406 | Mick Malthouse | Footscray, West Coast, Collingwood, Carlton | |||
| 3 | 389 | Kevin Sheedy | Essendon, Greater Western Sydney | |||
| 4 | 357 | Allan Jeans | St Kilda, Hawthorn, Richmond | |||
| 5 | 336 | Tom Hafey | Richmond, Collingwood, Geelong, Sydney | |||
| Source: . Last updated: 31 May 2015. | ||||||
Most premierships as coach
| Rank | Total | Coach | Year | |||
|---|---|---|---|---|---|---|
| 1 | 8 | Jock McHale | 1917, 1919,1927, 1928, 1929, 1930, 1935, 1936 | |||
| 2 | 6 | Norm Smith | 1955, 1956, 1957, 1959, 1960, 1964 | |||
| 3 | 5 | Jack Worrall | 1906, 1907, 1908, 1911, 1912 | |||
| 5 | Frank 'Checker' Hughes | 1932, 1939, 1940, 1941, 1948 | ||||
| 5 | 4 | Dick Reynolds | 1942, 1946, 1949, 1950 | |||
| 4 | Tom Hafey | 1967, 1969, 1973, 1974 | ||||
| 4 | Ron Barassi | 1968, 1970, 1975, 1977 | ||||
| 4 | Allan Jeans | 1966, 1983, 1986, 1989 | ||||
| 4 | David Parkin | 1978, 1981, 1982, 1995 | ||||
| 4 | Kevin Sheedy | 1984, 1985, 1993, 2000 | ||||
| 4 | Leigh Matthews | 1990, 2001, 2002, 2003 | ||||
| 4 | Alastair Clarkson | 2008, 2013, 2014, 2015 | ||||
| Source: . Last updated: 6 January 2016. | ||||||
Player/Coach
Most games played and coached
| Rank | Total | Coach/Player | Teams Coached | Games Coached | Teams Played For | Games Played | |
|---|---|---|---|---|---|---|---|
| 1 | 929 | Kevin Sheedy | Essendon, Greater Western Sydney | 678 | Richmond | 251 | |
| 2 | 892 | Mick Malthouse | Footscray, West Coast, Collingwood, Carlton | 718 | St Kilda, Richmond | 174 | |
| 3 | 878 | Jock McHale | Collingwood | 714 | Collingwood | 261 (97 games as playing coach) | |
| 4 | 793 | Leigh Matthews | Collingwood, Brisbane | 461 | Hawthorn | 332 | |
| 5 | 729 | David Parkin | Hawthorn, Carlton, Fitzroy | 518 | Hawthorn | 211 | |
| Source:AFL Tables - Coaches Last updated: 31 May 2015. | |||||||
Awards
Most Brownlow Medals
- For a year-by-year list, see List of Brownlow Medal winners.
| Rank | Awards | Player | Club/Clubs | Years |
|---|---|---|---|---|
| 1 | 3 | Haydn Bunton, Sr. | Fitzroy | 1931, 1932, 1935 |
| 3 | Dick Reynolds | Essendon | 1934, 1937, 1938 | |
| 3 | Bob Skilton | South Melbourne | 1959, 1963, 1968 | |
| 3 | Ian Stewart | St Kilda, Richmond | 1965, 1966, 1971 |
Most club best and fairests
| Rank | Awards | Player | Club/Clubs | Years |
|---|---|---|---|---|
| 1 | 9 | Kevin Murray | Fitzroy | 1956, 1958, 1960, 1961, 1962, 1963, 1964, 1968, 1969 |
| 9 | Bob Skilton | South Melbourne | 1958, 1959, 1961, 1962, 1963, 1964, 1965, 1967, 1968 | |
| 3 | 8 | Leigh Matthews | Hawthorn | 1971, 1972, 1974, 1976, 1977, 1978, 1980, 1982 |
| 4 | 7 | Dick Reynolds | Essendon | 1934, 1936, 1937, 1938, 1939, 1942, 1943 |
| 7 | Bill Hutchison | Essendon | 1947, 1948, 1950, 1952, 1953, 1955, 1956 | |
| 7 | Gary Dempsey | Footscray, North Melbourne | 1970, 1973, 1974, 1975, 1976, 1977, 1979 | |
| 7 | Scott West | Western Bulldogs | 1995, 1997, 1998, 2000, 2003, 2004, 2005 |
See also
References
External links
This article is issued from Wikipedia - version of the 11/25/2016. The text is available under the Creative Commons Attribution/Share Alike but additional terms may apply for the media files.