Polynomiography
Polynomiography is the algorithmic visualization of polynomial equations for aesthetic, mathematical, and educational purposes. It is a nascent technique for polynomial root-finding with potential application in art, mathematics, and education.
Introduction
The concept of Polynomiography arose out of a problem concerning polynomial root-finding in the 1990s by Bahman Kalantari. Kalantari became interested in polynomial root-finding when he was designing masters’ questions for an exam, related to approximations of the square root of two. As he delved deeper into the matter, his interest was piqued at the possibility of generating computer visualizations of the root-finding process. Images thus generated would be related to fractals, but distinct in that the former affords more control over the design than the latter.[1] Additionally, a polynomiography image, called a polynomiograph, does not necessarily exhibit fractal patterns.
-

Non-fractal polynomiograph of the polynomial
-

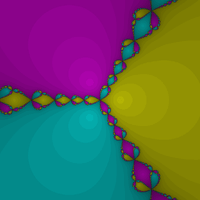
Newton fractal for three degree-3 roots coloured by root reached
The name polynomiography was subsequently coined in 2000 as a portmanteau of the words polynomial and the Greek suffix -graphy.[2] In 2005 Kalantari obtained a U.S. patent for the technology of Polynomiography. [3]
Definition
In its simplest form, a polynomial is a mathematical expression involving variables of varying powers, such as
.
A naive way to find the roots of a polynomial expression is to graph the equation and find the zeroes, where the graph crosses the horizontal (x-)axis. For more complex polynomials, finding the roots graphically can be quite difficult. In light of this, mathematicians have developed algorithms for finding the roots of polynomials without having to plot them graphically. These are usually methods that use iteration to converge upon a root; they locate an area that is a starting point for the root of the polynomial, then progress using an algorithm to find a better point, in order to reach a limit for the approximation of the root.[4]
Polynomiography is the algorithmic visualization of polynomial equations, making use of one or more of these iterative techniques. The iterative methods may consist of using iteration functions. A particular family of iterations used extensively in polynomiography is the Basic Family. Polynomiography results in a 2D image called a polynomiograph that may or may not exhibit fractal or chaotic behavior. More broadly, a polynomiograph may be a 3D or even 4D object, such as in the context of quaternion polynomial root-finding.[5]
Applications
Art
Polynomiography has applications in a number of artistic practices, including design. One does not need formal training in mathematics to use the software, as it is designed in order to provide wide accessibility. Polynomiographs have been used as inspiration for many mediums, such as painting, sculpting, and weaving.[6] In the summer of 2015 Kalantari partnered with Western Illinois University professor Fedor Andreev to create Poly-Z-Vizion, an iOS app which provides an intuitive, user-friendly way to generate polynomiographs on mobile devices.[7]
-

A polynomiographic Persian carpet, done by Alinasab.
-

a polynomial with two fixed roots and one variable root the user can move around to change the shape of the polynomiograph.
Education
In addition to its aesthetic use, polynomiography has been seen as a tool in assisting children understand algebraic concepts. Colorful polynomiographs provide a visual aid to students just beginning to understand algebra and polynomial roots. In addition, the interactivity and accessibility of polynomiography software allows students to try their own hand at generating polynomiographs, serving as a useful starting point for educators to springboard into more rigorous discussion of algebra and polynomial functions.[8][9][10]
Mathematics
Polynomials themselves have vast uses in mathematics, including interpolation and various fields of engineering. Polynomiography extends those uses by allowing users to see clearly the basins of attraction and speed of convergence of a selected root-finding method.[11][12] This can give greater insight into various classes of polynomials.[13] It can also be used as an alternative representation of graphs. It has potential application in statistics.
References
- ↑ Bahman Kalantari. "Polynomial Root-Finding and Polynomiography". Retrieved 2015-09-04.
- ↑ , ACM SIGGRAPH, Volume 38 Number 3, August 2004.
- ↑ Krzysztof Gdawiec. "Polynomiography and Various Convergence Tests". Retrieved 2015-10-01.
- ↑ Peterson, Ivars. "The Colors of an Equation's Roots". Retrieved 2015-10-21.
- ↑ Kalantari, Bahman (2013). "Algorithms for Quaternion Polynomiography-Root Finding". Journal of Complexity. 29: 302–322.
- ↑ Bahman Kalantari. "Two and Three-Dimensional Art Inspired by Polynomiography" (PDF). Retrieved 2015-09-24.
- ↑ Jodi Pospeschil. "WIU Professor Transitions Fractal Art to App Technology". Retrieved 2015-10-19.
- ↑ Pat Ellard. "The Art of Science" (PDF). Retrieved 2015-09-03.
- ↑ "Do You Know About Polynomiography?". Randolph Township Board of Education. Retrieved 2015-09-04.
- ↑ Megan Lotts. "Implementing a culture of creativity". Association of College and Research Libraries. Retrieved 2015-09-24.
- ↑ Krzysztof Gdawiec, Wiesław Kotarski, and Agnieszka Lisowska. "Polynomiography Based on the Nonstandard Newton-Like Root Finding Methods".
- ↑ Krzysztof Gdawiec. "Polynomiography and Various Convergence Tests". Retrieved 2015-09-04.
- ↑ Mathematica. "Polynomiography: Visualization of Polynomial Equations and New Challenges". Retrieved 2015-09-24.