SciDAVis
 | |
|
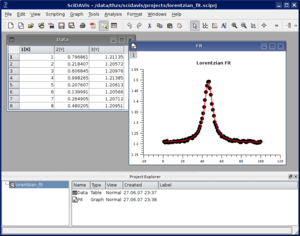
Screenshot of SciDAVis 0.1.0 on Linux | |
| Original author(s) | Tilman Benkert, Knut Franke [1] |
|---|---|
| Developer(s) | Arun Narayanankutty, Dmitriy Pozitron, Russell Standish[1] |
| Initial release | 5 August 2007 |
| Stable release |
1.14
/ 29 July 2016 |
| Development status | Active |
| Written in | C++, Python |
| Operating system | Microsoft Windows, OS X, Linux |
| Platform | x86 |
| Size | 23.2 MB |
| Available in | 7 languages |
| Type | Data analysis and plotting |
| License | GNU GPLv2 |
| Website |
scidavis |
| As of | 25 April 2016 |
SciDAVis (Scientific Data Analysis and Visualization) is an open-source cross-platform computer program for interactive scientific graphing and data analysis. Development started in 2007 as fork of QtiPlot, which in turn is a clone of the proprietary program Origin.
Features
SciDAVis can generate different types of 2D and 3D plots (such as line, scatter, bar, pie, and surface plots) from data that is either imported from ASCII files, entered by hand, or calculated using formulas.[2] The data is held in spreadsheets which are referred to as tables with column-based data (typically X and Y values for 2D plots) or matrices (for 3D plots). The spreadsheets as well as graphs and note windows are gathered in a project and can be organized using folders. The built-in analysis operations include column/row statistics, (de)convolution, FFT and FFT-based filters. Curve fitting can be performed with user-defined or built-in linear and nonlinear functions, including multi-peak fitting, based on the GNU Scientific Library. The plots can be exported to several bitmap formats, PDF, EPS or SVG. Note windows support in-place evaluation of mathematical expressions or an optional scripting interface to Python. The GUI of the application uses the Qt toolkit.
History
SciDAVis was founded by Tilman Benkert and Knut Franke in 2007 as a fork of QtiPlot, after disagreements arose with Ion Vasilief, the founder and main developer of the project.[3] Franke has stated that the topics of disagreement included "design goals, management of community resources and the right way to make money from a free software project".[3]
In 2008, developers of SciDAVis and LabPlot "found their project goals to be very similar" and "decided to start a close cooperation" with the aim of merging their code into a common backend, while maintaining "two frontends, one with full KDE4 integration (called LabPlot 2.x) and one with no KDE dependencies (pure Qt so to say) for easier cross-platform use (called SciDAVis)".[4] After stalled development for several years, updates to SciDAVis have resumed.
Release history
- 2007-08-05: Release 0.1.0
- 2007-12-21: Release 0.1.1
- 2008-02-03: Release 0.1.2
- 2008-04-19: Release 0.1.3
- 2009-02-10: Release 0.1.4
- 2009-02-14: Release 0.2.0
- 2009-03-09: Release 0.2.1
- 2009-04-20: Release 0.2.2
- 2009-07-12: Release 0.2.3
- 2010-03-12: Release 0.2.4
- 2014-01-23: Release 1.D1
- 2014-02-05: Release 1.D4
- 2014-03-21: Release 1.D5
- 2014-08-26: Release 1.D8
- 2015-11-24: Release 1.D9
- 2016-06-05: Release 1.D13
- 2016-07-29: Release 1.14[5]
See also
References
- ↑ "The SciDAVis Handbook".
- 1 2 Jarvis, Stuart (2009-10-16). "LabPlot and SciDAVis Collaborate on the Future of Free Scientific Plotting". KDE Dot News. KDE. Retrieved 2011-04-08.
- ↑ http://scidavis.sourceforge.net/about/index.html
- ↑ http://sourceforge.net/projects/scidavis/files/SciDAVis/
External links
- SciDAVis website
- SciDAVis project page at Sourceforge
- LabPlot and SciDAVis Collaborate on the Future of Free Scientific Plotting - KDE News
- openSUSE packages
- Debian packages (included in the Debian repository)
