St George (UK Parliament constituency)
St George | |
---|---|
Former Borough constituency for the House of Commons | |
1885–1918 | |
Number of members | one |
Replaced by | Whitechapel and St George's |
Created from | Tower Hamlets |
St George was a parliamentary constituency in what is now the London Borough of Tower Hamlets. It was part of the Parliamentary borough of Tower Hamlets and returned one Member of Parliament to the House of Commons of the Parliament of the United Kingdom.
History
The constituency, formally known as Tower Hamlets, St George Division, was created by the Redistribution of Seats Act 1885 by the division of the existing two-member parliamentary borough of Tower Hamlets into seven divisions, each returning one MP.[1]
This was an area on the north bank of the River Thames, with a lot of its inhabitants employed as dock workers or in the sugar refining industry. Pelling comments that it had the largest proportion of immigrant Irishmen in the metropolis.
The constituency was marginal between the Conservative and Liberal parties. Pelling suggests the Conservative MP, elected in 1885, owed his victory to generosity "bordering on corruption". Political issues important in the area were protectionism (as sugar refining was damaged by foreign subsidies to rivals) and the immigration of "pauper aliens" (the neighbouring division of Whitechapel had a large population of immigrant Jews).
The seat was abolished for the 1918 general election. The area was incorporated in a new seat of Stepney, Whitechapel and St George's.
Boundaries
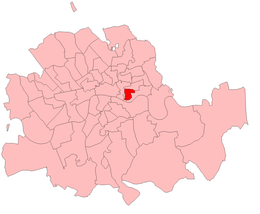
The constituency comprised two civil parishes: St George in the East and Wapping.[1] Although lying in Middlesex, the parishes formed part of the East End of London, and were administered as part of the Metropolis.
In 1889 the area was removed from Middlesex to the new County of London, and in 1900 it was included in the Metropolitan Borough of Stepney, but no changes were made to constituency boundaries until 1918.
Members of Parliament
Election | Member | Party | |
---|---|---|---|
1885 | Charles Thomson Ritchie | Conservative | |
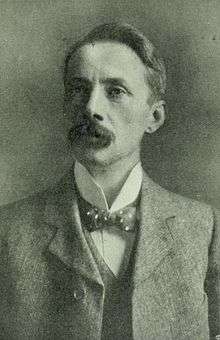
1892 | John Williams Benn | Liberal | |
1895 | Harry Hananel Marks | Conservative | |
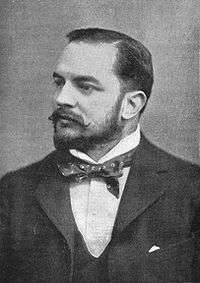
1900 | Sir Thomas Robert Dewar | Conservative | |
1906 | William Wedgwood Benn | Liberal | |
1918 | constituency abolished |
Election results
Elections in the 1880s
Party | Candidate | Votes | % | ± | |
---|---|---|---|---|---|
Conservative | Charles Thomson Ritchie | 1,744 | 59.6 | ||
Liberal | Sir David Salomons | 1,180 | 40.4 | ||
Majority | 564 | 19.2 | |||
Turnout | 4,317 | 67.7 | |||
Party | Candidate | Votes | % | ± | |
---|---|---|---|---|---|
Conservative | Charles Thomson Ritchie | 1,561 | 59.2 | ||
Liberal | Richard Eve | 1,076 | 40.8 | ||
Majority | 485 | 18.4 | |||
Turnout | 4,317 | 61.1 | |||
Conservative hold | Swing | -0.4 | |||
Party | Candidate | Votes | % | ± | |
---|---|---|---|---|---|
Conservative | Charles Thomson Ritchie | 1,546 | 63.5 | ||
Liberal | Richard Eve | 889 | 36.5 | ||
Majority | 657 | 27.0 | |||
Turnout | 4,317 | 56.4 | |||
Conservative hold | Swing | +4.3 | |||
Elections in the 1890s
Party | Candidate | Votes | % | ± | |
---|---|---|---|---|---|
Liberal | John Williams Benn | 1,661 | 56.8 | ||
Conservative | Charles Thomson Ritchie | 1,263 | 43.2 | ||
Majority | 398 | 13.6 | |||
Turnout | 3,755 | 77.9 | |||
Liberal gain from Conservative | Swing | +20.3 | |||
Party | Candidate | Votes | % | ± | |
---|---|---|---|---|---|
Conservative | Henry Hananel Marks | 1,583 | 50.1 | ||
Liberal | John Williams Benn | 1,579 | 49.9 | ||
Majority | 4 | 0.2 | |||
Turnout | 3,824 | 82.7 | |||
Conservative gain from Liberal | Swing | +6.9 | |||
Elections in the 1900s
Party | Candidate | Votes | % | ± | |
---|---|---|---|---|---|
Conservative | Thomas Robert Dewar | 1,437 | 55.7 | +5.6 | |
Liberal | Bertram Stuart Straus | 1,141 | 44.3 | -5.6 | |
Majority | 296 | 11.4 | +11.2 | ||
Turnout | 3,518 | 73.3 | -9.4 | ||
Conservative hold | Swing | +5.6 | |||
Party | Candidate | Votes | % | ± | |
---|---|---|---|---|---|
Liberal | William Wedgwood Benn | 1,685 | 61.3 | ||
Conservative | H. Hallifax Wells | 1,064 | 38.7 | ||
Majority | 621 | 22.6 | |||
Turnout | 3,246 | 84.7 | |||
Liberal gain from Conservative | Swing | +17.0 | |||
Elections in the 1910s
Party | Candidate | Votes | % | ± | |
---|---|---|---|---|---|
Liberal | William Wedgwood Benn | 1,568 | 58.0 | -3.3 | |
Conservative | Percy Coleman Simmons | 1,134 | 42.0 | +3.3 | |
Majority | 434 | 16.0 | -6.6 | ||
Turnout | |||||
Liberal hold | Swing | -3.3 | |||
Party | Candidate | Votes | % | ± | |
---|---|---|---|---|---|
Liberal | William Wedgwood Benn | 1,598 | 59.5 | +1.5 | |
Conservative | Percy Coleman Simmons | 1,089 | 40.5 | -1.5 | |
Majority | 509 | 19.0 | +3.0 | ||
Turnout | |||||
Liberal hold | Swing | +1.5 | |||
Party | Candidate | Votes | % | ± | |
---|---|---|---|---|---|
Liberal | William Wedgwood Benn | 1,401 | 57.8 | -1.7 | |
Conservative | Douglas Clifton Brown | 1,022 | 42.2 | +1.7 | |
Majority | 379 | 15.6 | -3.4 | ||
Turnout | |||||
Liberal hold | Swing | -1.7 | |||
References
- 1 2 Youngs, Frederic A, Jr. (1979). Guide to the Local Administrative Units of England, Vol.I: Southern England. London: Royal Historical Society. p. 749. ISBN 0-901050-67-9.
- ↑ Craig, F.W.S. (1974). British parliamentary election results 1885-1918 (1 ed.). London: Macmillan.
- Boundaries of Parliamentary Constituencies 1885-1972, compiled and edited by F.W.S. Craig (Parliamentary Reference Publications 1972)
- British Parliamentary Election Results 1885-1918, compiled and edited by F.W.S. Craig (The Macmillan Press 1974)
- Social Geography of British Elections 1885-1910, by Henry Pelling (Macmillan 1967)
- Leigh Rayment's Historical List of MPs – Constituencies beginning with "S" (part 1)