1963 Pacific hurricane season
| |
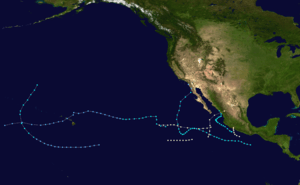
| Season summary map |
| First system formed |
July 14, 1963 |
| Last system dissipated |
October 14, 1963 |
| Strongest storm1 |
Mona – 961 mbar (hPa) (28.38 inHg), 100 mph (155 km/h) |
| Total depressions |
8 |
| Total storms |
8 |
| Hurricanes |
4 |
| Total fatalities |
Unknown |
| Total damage |
Unknown |
| 1Strongest storm is determined by lowest pressure |
Pacific hurricane seasons
1961, 1962, 1963, 1964, 1965 |
The 1963 Pacific hurricane season was a below-average season, with 8 storms and 4 hurricanes forming. The season ran through the summer and fall of 1963.
The strongest of these storms were Glenda and Mona, which both had 85 mph (135 km/h) winds. The first storm, Emily, made landfall near Manzanillo, Mexico as a Category 1 hurricane. The next hurricanes, Florence and Glenda, stayed far away from land. Jennifer-Katherine made landfall on Baja California as a tropical depression on September 18. Tropical Storm Irah affected Hawaii as a tropical depression. An unnamed tropical storm curved round Hawaii from 2-8 August. Lillian became post-tropical shortly before making landfall on September 29 with winds of 50 mph. Mona, the final storm of the season made landfall around about the same area as Lillian did with winds of 85 mph.
Storms
Timeline of activity in the 1963 Pacific hurricane season
Hurricane Emily
| Category 1 hurricane (SSHWS) |
|
|
| Duration |
29 June – 30 June |
| Peak intensity |
85 mph (140 km/h) (1-min) 996[1] mbar (hPa) |
Hurricane Emily formed on June 29 while moving west. It then turned to the north and dissipated over the mountainous regions of Mexico.
Hurricane Florence
| Category 1 hurricane (SSHWS) |
|
|
| Duration |
14 July – 17 July |
| Peak intensity |
85 mph (140 km/h) (1-min) 992[1] mbar (hPa) |
Hurricane Florence followed nearly a due west track as it persisted to move away from land and eventually weakened and dissipated without any affect on a landmass.
Hurricane Glenda
| Category 1 hurricane (SSHWS) |
|
|
| Duration |
19 July – 21 July |
| Peak intensity |
85 mph (140 km/h) (1-min) 997[1] mbar (hPa) |
Hurricane Glenda stayed at sea.
Tropical Storm Four
| Tropical storm (SSHWS) |
|
|
| Duration |
2 August – 8 August |
| Peak intensity |
50 mph (85 km/h) (1-min) |
Tropical Storm Four stayed over the ocean. Several vessels encountered gale force winds in this storm from the 8th through the 10th as it proceeded northward across the shipping lanes. On the 12th the remnants of the cyclone dissipated near 50N 165W.
Tropical Storm Jennifer-Katherine
| Tropical storm (SSHWS) |
|
|
| Duration |
9 September – 18 September |
| Peak intensity |
50 mph (85 km/h) (1-min) 996[1] mbar (hPa) |
Tropical Storm Jennifer-Katherine moved through the Eastern Pacific in mid-September. It moved northward, and hit Baja California on September 18, bringing heavy rain to southern California. A total of 6.50 inches (165 mm) fell in the mountains of southern California from the storm.[2] The storm had two names because it was assumed that Jennifer dissipated and Katherine reformed, but it was in actuality one storm.
Tropical Storm Irah
| Tropical storm (SSHWS) |
|
|
| Duration |
12 September – 21 September |
| Peak intensity |
50 mph (85 km/h) (1-min) 999[1] mbar (hPa) |
Irah peaked at a tropical storm and made a direct hit on Hawaii. . A TIROS satellite photo taken on the 29th, locating it near 25N 175E in the Western Pacific.
Tropical Storm Lillian
| Tropical storm (SSHWS) |
|
|
| Duration |
24 September – 29 September |
| Peak intensity |
50 mph (85 km/h) (1-min) 991[1] mbar (hPa) |
Tropical Storm Lillian paralleled the Mexican coast. It was originally moving to the north-west but turned to the west-northeast on 28 September hit Western Mexico as a tropical storm.
Hurricane Mona
| Category 1 hurricane (SSHWS) |
|
|
| Duration |
17 October – 19 October |
| Peak intensity |
85 mph (140 km/h) (1-min) 961[1] mbar (hPa) |
Hurricane Mona hit western Mexico on October 19.
Storm names
- Ava (unused)
- Bernice (unused)
- Claudia (unused)
- Doreen (unused)
- Emily
- Florence
- Glenda
|
- Hazel
- Irah
- Jennifer
- Katherine
- Lilian
- Mona
- Natalie (unused)
|
- Odessa (unused)
- Prudence (unused)
- Roslyn (unused)
- Sylvia (unused)
- Tillie (unused)
- Victoria (unused)
- Wallie (unused)
|
Accumulated Cyclone Energy (ACE)
| ACE (104kt²) ([[|Source]]) — Storm: |
|---|
| 1 | 7.49 | Jen-kat
| 5 | 3.44 | Lillian
|
|---|
| 2 | 7.31 | Florence
| 6 | 2.63 | Irah
|
|---|
| 3 | 5.06 | Glenda
| 7 | 2.18 | Mona
|
|---|
| 4 | 3.94 | Emily
| | | |
|---|
| Total: 32.1 |
|---|
The table on the right shows the ACE for each storm in the season. Broadly speaking, the ACE is a measure of the power of a hurricane multiplied by the length of time it existed, so storms that last a long time, as well as particularly strong hurricanes, have high ACEs. ACE is calculated for only full advisories on specifically tropical systems reaching or exceeding wind speeds of 34 knots (39 mph, 63 km/h), or tropical storm strength. Accordingly, tropical depressions are not included here. The ACE also does not include subtropical storms. Later the NHC reexamines the data, and produces a final report on each storm, which can lead to the ACE for a storm being revised either upward or downward. Until the final reports are issued, ACEs are, therefore, provisional.
References
- 1 2 3 4 5 6 7 National Oceanic and Atmospheric Administration (1963). "The Climatological Data National Summary 1963". National Climatic Data Center. Retrieved 2014-08-13.
- ↑ National Weather Service Forecast Office San Diego, California. Warnings for Tropical Storm Jennifer were issued from September 12 through 15 when a lack of observations led to an ending of observations. The final position was extrapolated at 18.8N 121.7W. Tropical Storm Katherine was identified on September 17 near 28.5N 117.0W and advisories were initiated. A History of Significant Local Weather Events. Retrieved on 2007-02-02.
See also


