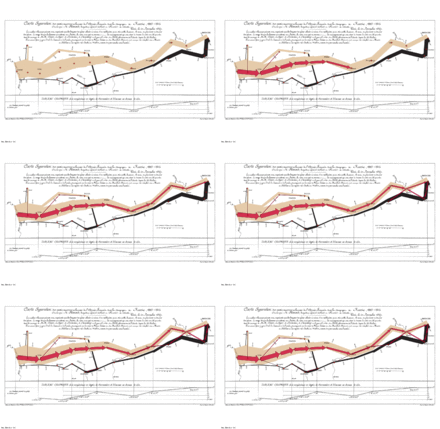
Visualization software

Visualization software or visualisation software is a range of computer graphics products used to create graphical displays and interfaces for software applications. These products include libraries of graphical components or graphic objects (e.g., common charts, Gantt charts, diagrams and realistic equipment images) and software editors for building and deploying data displays for applications. Primarily used in graphical user interfaces, these products support common platforms, including Java, .NET, Flex, and C++, and are used in desktop and web-based applications. They are used in different industries, including transportation, telecommunications, manufacturing and defense, to display information in formats designed to be easily understood. These displays are primarily for applications requiring custom, high-performance interfaces that are scalable and industry specific.
Deployment options
- Web
- Desktop
- Small portable devices (cell phones, PDAs)
Visualization applications
- Network monitoring
- Process monitoring
- Traffic control
- Production management
- Train traffic control
- Manufacturing processes
- Rich Internet Applications (RIA)
Visualization technologies
- Ajax
- GIS
- Model-View-Controller (MVC) architecture
- Software Development Kits (SDKs)
- Java 2D
- Swing APIs
- Styling and Data Mapping (SDM)
- DMS latitude/longitude, decimal degrees, UTM or MGRS
- Vector
- Raster
- Geocentric
- Geodesic
- Decimal Lat/Lon
Visualization standards
- NATO APP-6A/MIL-STD 2525B
- ESRI
- GeoTIFF
- DTED 0, 1 & 2
- GTOPO30 DEM
- MapInfo
- Oracle Spatial
- TIGER/Line
- DMS Lat/Lon
- UTM
- GRS 80
- North American 1983 (CONUS)
- Geodetic
- NIMA/NGA
- XML
- Digest
- Java2
- XML
- DIGEST
- NIMA
- RPF
- VPF
- SBGN
Associations
Books
- “Application Design: Best Practices for Web-Based Software,” by Susan Fowler and Victor Stanwick (Elsvier)
- Battiti, Roberto; Mauro Brunato (2011). Reactive Business Intelligence. From Data to Models to Insight. Trento, Italy: Reactive Search Srl. ISBN 978-88-905795-0-9., about integrating data mining, modeling and interactive visualization.
See also
Graphic objects
Graphic objects are computer images used to represent resources and data in graphical displays. For example, in telephone network management, they can represent lines and nodes (e.g., junction points, phones and computer centers) and performance information, and IT commonly uses them to represent equipment (e.g., servers, clients and routers). They are often referred to as icons.