Austrian legislative election, 1995
Austrian legislative election, 1995

|
|
|
|
All 183 seats in the National Council
92 seats needed for a majority |
| Turnout |
4,959,455 (85.98%)[1] |
| |
First party |
Second party |
Third party |
| |
 |
 |
 |
| Leader |
Franz Vranitzky |
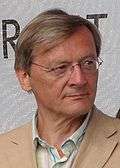
Wolfgang Schüssel |
Jörg Haider |
| Party |
SPÖ |
ÖVP |
FPÖ |
| Leader since |
1988 |
1995 |
1986 |
| Leader's seat |
9 Vienna |
9E Vienna South-West |
2A Klagenfurt |
| Last election |
65 seats, 34.92% |
52 seats, 27.67% |
42 seats, 22.50% |
| Seats won |
71 |
52 |
41 |
| Seat change |
 6 6 |
0 |
 1 1 |
| Popular vote |
1,843,474 |
1,370,510 |
1,060,377 |
| Percentage |
38.06% |
28.29% |
21.89% |
| Swing |
 3.14% 3.14% |
 0.62% 0.62% |
 0.61% 0.61% |
|
| |
Fourth party |
Fifth party |
| |
 |
 |
| Leader |
Heide Schmidt |
Madeleine Petrovic |
| Party |
LiF |
Greens |
| Leader since |
1993 |
1994 |
| Leader's seat |
9F Vienna North-West |
9F Vienna North-West |
| Last election |
11 seats, 5.97% |
13 seats, 7.31% |
| Seats won |
10 |
9 |
| Seat change |
 1 1 |
 4 4 |
| Popular vote |
267,026 |
233,208 |
| Percentage |
5.51% |
4.81% |
| Swing |
 0.45% 0.45% |
 2.50% 2.50% |
|
|
|
Early parliamentary elections were held in Austria on 17 December 1995,[2] after the Grand Coalition between the Social Democratic Party (SPÖ) and Austrian People's Party collapsed over disagreements about the budget. The SPÖ remained the largest party in the National Council and the Grand Coalition was reformed. Voter turnout was 86.0%.[3]
Results
| Party |
Votes |
% |
Seats |
+/– |
|---|
| Social Democratic Party | 1,843,474 | 38.1 | 71 | +6 |
| Austrian People's Party | 1,370,510 | 28.3 | 52 | 0 |
| Freedom Party of Austria | 1,060,377 | 21.9 | 41 | –1 |
| Liberal Forum | 267,026 | 5.5 | 10 | –1 |
| Green Alternative | 233,208 | 4.8 | 9 | –4 |
| No - Civic Action Group against the sale of Austria | 53,176 | 1.1 | 0 | 0 |
| Communist Party of Austria | 13,938 | 0.3 | 0 | 0 |
| Austrian Natural Law Party | 1,634 | 0.0 | 0 | 0 |
| The Best Party | 830 | 0.0 | 0 | 0 |
| Invalid/blank votes | 115,282 | – | – | – |
| Total | 4,959,455 | 100 | 183 | 0 |
| Source: Nohlen & Stöver |
| Popular vote |
|---|
|
|
|
|
|
| SPÖ |
|
38.06% |
| ÖVP |
|
28.29% |
| FPÖ |
|
21.89% |
| LIF |
|
5.51% |
| GRÜNE |
|
4.81% |
| NEIN |
|
1.10% |
| Other |
|
0.34% |
| Parliamentary seats |
|---|
|
|
|
|
|
| SPÖ |
|
38.80% |
| ÖVP |
|
28.42% |
| FPÖ |
|
22.40% |
| LIF |
|
5.46% |
| GRÜNE |
|
4.92% |
References


