Aylesbury Vale District Council election, 2007
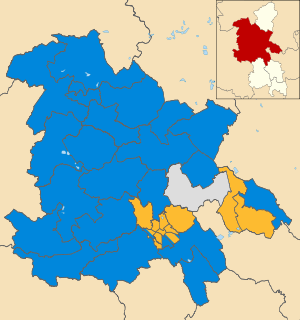
Map of the results of the 2007 Aylesbury Vale council election. Conservatives in blue, Liberal Democrats in yellow and Independents in grey.
Elections to Aylesbury Vale District Council were held on 3 May 2007. The whole council was up for election and the Conservative Party held overall control of the council.
Results
| Aylesbury Vale Local Election Result 2007 | ||||||||||
|---|---|---|---|---|---|---|---|---|---|---|
| Party | Seats | Gains | Losses | Net gain/loss | Seats % | Votes % | Votes | +/− | ||
| Conservative | 37 | 9 | 2 | +7 | 62.7 | 52.5 | 49,013 | +4.3% | ||
| Liberal Democrat | 21 | 3 | 7 | -4 | 35.6 | 35.1 | 32,807 | -4.9% | ||
| Independent | 1 | 0 | 3 | -3 | 1.7 | 2.3 | 2,163 | -2.9% | ||
| UKIP | 0 | 0 | 0 | 0 | 0 | 5.1 | 4,730 | +4.9% | ||
| Labour | 0 | 0 | 0 | 0 | 0 | 5.0 | 4,705 | -0.5% | ||
1 Conservative candidate was unopposed.
By ward
| Party | Candidate | Votes | % | ± | |
|---|---|---|---|---|---|
| Conservative | Bill Chapple | 2,200 | |||
| Conservative | Carole Paternoster | 2,109 | |||
| Conservative | David Thompson | 1,889 | |||
| Liberal Democrat | Pamela Crawford | 653 | |||
| Liberal Democrat | Jeremy Hodge | 652 | |||
| Liberal Democrat | Chester Jones | 545 | |||
| UKIP | Lynne Roberts | 461 | |||
| Turnout | 8,509 | 42 | |||
| Conservative hold | Swing | ||||
| Conservative hold | Swing | ||||
| Conservative hold | Swing | ||||
| Party | Candidate | Votes | % | ± | |
|---|---|---|---|---|---|
| Liberal Democrat | Keith Turner | 409 | 52.5 | -0.5 | |
| Conservative | Sharaz Khan | 283 | 36.3 | +3.8 | |
| UKIP | Brian Adams | 87 | 11.2 | +11.2 | |
| Majority | 121 | 16.2 | -4.3 | ||
| Turnout | 779 | 36 | |||
| Liberal Democrat hold | Swing | ||||
| Party | Candidate | Votes | % | ± | |
|---|---|---|---|---|---|
| Liberal Democrat | Penni Thorne | 1,601 | |||
| Liberal Democrat | Alan Sherwell | 1,490 | |||
| Conservative | Jenny Bloom | 1,478 | |||
| Liberal Democrat | Mark Willis | 1,392 | |||
| Conservative | Mike Arrowsmith | 1,325 | |||
| Conservative | Andrew Huxley | 1,255 | |||
| UKIP | Daniel Lewis | 306 | |||
| Labour | Ruth McGoldrick | 186 | |||
| Labour | Philip McGoldrick | 168 | |||
| Turnout | 9,201 | 48 | |||
| Liberal Democrat hold | Swing | ||||
| Liberal Democrat hold | Swing | ||||
| Conservative gain from Liberal Democrat | Swing | ||||
| Party | Candidate | Votes | % | ± | |
|---|---|---|---|---|---|
| Liberal Democrat | Jacqui Mallard | 387 | 54.7 | +24.5 | |
| Conservative | David Carruthers | 275 | 38.8 | +15.5 | |
| UKIP | Nicola Adams | 46 | 6.5 | +6.5 | |
| Majority | 112 | 15.9 | |||
| Turnout | 708 | 52 | |||
| Liberal Democrat gain from Independent | Swing | ||||
| Party | Candidate | Votes | % | ± | |
|---|---|---|---|---|---|
| Conservative | Michael Rand | 597 | 62.6 | +9.0 | |
| Labour | Joanna Dodsworth | 191 | 20.0 | -3.7 | |
| Liberal Democrat | Madeleine Croydon | 166 | 17.4 | -5.3 | |
| Majority | 406 | 42.6 | +12.7 | ||
| Turnout | 954 | 47 | |||
| Conservative hold | Swing | ||||
| Party | Candidate | Votes | % | ± | |
|---|---|---|---|---|---|
| Conservative | Derrick Isham | 832 | |||
| Conservative | Timothy Mills | 814 | |||
| Labour | Ruth Newell | 316 | |||
| Labour | Pamela Desorgher | 236 | |||
| Liberal Democrat | Andrew Horton | 231 | |||
| UKIP | Alfred May | 162 | |||
| Turnout | 2,591 | 29 | |||
| Conservative hold | Swing | ||||
| Conservative hold | Swing | ||||
| Party | Candidate | Votes | % | ± | |
|---|---|---|---|---|---|
| Conservative | Hedley Cadd | 820 | |||
| Conservative | Huw Lewis | 740 | |||
| Labour | Robin Stuchbury | 561 | |||
| Labour | Mike Smith | 309 | |||
| UKIP | Rhys Paul Ashall | 117 | |||
| Turnout | 2,547 | 34 | |||
| Conservative hold | Swing | ||||
| Conservative hold | Swing | ||||
| Party | Candidate | Votes | % | ± | |
|---|---|---|---|---|---|
| Liberal Democrat | Corry Cashman | 573 | 48.6 | -10.1 | |
| Conservative | Chris Poll | 507 | 43.0 | +1.7 | |
| UKIP | Nicholas Griffin | 100 | 8.5 | +8.5 | |
| Majority | 66 | 5.6 | -11.8 | ||
| Turnout | 1,180 | 51 | |||
| Liberal Democrat hold | Swing | ||||
| Party | Candidate | Votes | % | ± | |
|---|---|---|---|---|---|
| Liberal Democrat | Paul Hughes | 1,095 | |||
| Liberal Democrat | Steven Lambert | 1,067 | |||
| Conservative | Andrew Cole | 959 | |||
| Liberal Democrat | Tom Ahmed | 898 | |||
| Conservative | Mark Winn | 789 | |||
| Conservative | Talib Hussain | 726 | |||
| Labour | Neal Bonham | 179 | |||
| UKIP | Bruce Bolton | 173 | |||
| UKIP | Ruth Bolton | 154 | |||
| Turnout | 6,040 | 34 | |||
| Liberal Democrat hold | Swing | ||||
| Liberal Democrat hold | Swing | ||||
| Conservative gain from Liberal Democrat | Swing | ||||
| Party | Candidate | Votes | % | ± | |
|---|---|---|---|---|---|
| Conservative | Terry Jones | 668 | 59.9 | +0.1 | |
| Liberal Democrat | Christine Sivers | 278 | 24.9 | -15.3 | |
| UKIP | Emma Bourne | 169 | 15.2 | +15.2 | |
| Majority | 390 | 35.3 | +15.7 | ||
| Turnout | 1,115 | 50 | |||
| Conservative hold | Swing | ||||
| Party | Candidate | Votes | % | ± | |
|---|---|---|---|---|---|
| Liberal Democrat | Raj Khan | 1,173 | |||
| Liberal Democrat | Jenny Puddefoot | 1,052 | |||
| Liberal Democrat | Joan Poole | 994 | |||
| Conservative | Andrew Gattward | 842 | |||
| Conservative | Abdul Khaliq | 841 | |||
| Conservative | Sue Severn | 772 | |||
| UKIP | Heather Ashcroft | 270 | |||
| Labour | Mick Rowlinson | 256 | |||
| Turnout | 6,200 | 35 | |||
| Liberal Democrat hold | Swing | ||||
| Liberal Democrat gain from Conservative | Swing | ||||
| Liberal Democrat gain from Conservative | Swing | ||||
| Party | Candidate | Votes | % | ± | |
|---|---|---|---|---|---|
| Liberal Democrat | Tuffail Hussain | 690 | |||
| Liberal Democrat | Kevin Peters | 634 | |||
| Conservative | Jane Sale | 376 | |||
| Conservative | Paul Milham | 319 | |||
| UKIP | Barbara Adams | 158 | |||
| Turnout | 2,177 | 29 | |||
| Liberal Democrat hold | Swing | ||||
| Liberal Democrat hold | Swing | ||||
| Party | Candidate | Votes | % | ± | |
|---|---|---|---|---|---|
| Conservative | Neil Blake | 662 | 68.2 | +11.1 | |
| Liberal Democrat | Valerie Twiss | 243 | 25.0 | -6.9 | |
| UKIP | Gareth Tyzack | 66 | 6.8 | +6.8 | |
| Majority | 419 | 43.2 | +18.0 | ||
| Turnout | 971 | 41 | |||
| Conservative hold | Swing | ||||
| Party | Candidate | Votes | % | ± | |
|---|---|---|---|---|---|
| Conservative | Billy Stanier | 814 | 87.1 | ||
| UKIP | John Thurley | 121 | 12.9 | ||
| Majority | 693 | 74.2 | |||
| Turnout | 935 | 42 | |||
| Conservative hold | Swing | ||||
| Party | Candidate | Votes | % | ± | |
|---|---|---|---|---|---|
| Conservative | John Cartwright | 644 | 75.9 | ||
| Liberal Democrat | Christopher Hodges | 204 | 24.1 | ||
| Majority | 440 | 51.8 | |||
| Turnout | 848 | 43 | |||
| Conservative hold | Swing | ||||
| Party | Candidate | Votes | % | ± | |
|---|---|---|---|---|---|
| Conservative | Judy Brandis | 1,869 | |||
| Conservative | Brian Foster | 1,498 | |||
| Conservative | Andrew Douglas-Bate | 1,469 | |||
| Liberal Democrat | Neil Stuart | 1,400 | |||
| Liberal Democrat | Ricky Jeffrey | 1,351 | |||
| Liberal Democrat | Patrick Mahon | 932 | |||
| UKIP | Stefanie Falie | 295 | |||
| Turnout | 8,814 | 48 | |||
| Conservative gain from Liberal Democrat | Swing | ||||
| Conservative hold | Swing | ||||
| Conservative gain from Independent | Swing | ||||
| Party | Candidate | Votes | % | ± | |
|---|---|---|---|---|---|
| Conservative | Michael Edmonds | 1,225 | |||
| Conservative | David Smith | 1,094 | |||
| Independent | Ann Hooton | 654 | |||
| Liberal Democrat | Elaine Stuart | 373 | |||
| Labour | Elizabeth Liggett | 264 | |||
| Turnout | 3,610 | 48 | |||
| Conservative hold | Swing | ||||
| Conservative hold | Swing | ||||
| Party | Candidate | Votes | % | ± | |
|---|---|---|---|---|---|
| Conservative | Stefan Balbuza | 670 | 80.4 | +4.3 | |
| Labour | Patricia Brook | 163 | 19.6 | -4.3 | |
| Majority | 507 | 60.8 | +8.6 | ||
| Turnout | 833 | 41 | |||
| Conservative hold | Swing | ||||
| Party | Candidate | Votes | % | ± | |
|---|---|---|---|---|---|
| Conservative | Sue Chapple | 1,195 | |||
| Conservative | Brian Roberts | 1,081 | |||
| Conservative | Phil Yerby | 1,080 | |||
| Liberal Democrat | Denise Summers | 966 | |||
| Liberal Democrat | Peter Vernon | 858 | |||
| Liberal Democrat | Niknam Hussain | 815 | |||
| UKIP | Gerard McCormack | 209 | |||
| Labour | Derek Harrison | 195 | |||
| Labour | Ron Gardner | 184 | |||
| Turnout | 6,583 | 39 | |||
| Conservative gain from Liberal Democrat | Swing | ||||
| Conservative gain from Liberal Democrat | Swing | ||||
| Conservative gain from Liberal Democrat | Swing | ||||
| Party | Candidate | Votes | % | ± | |
|---|---|---|---|---|---|
| Conservative | Jackie Phipps | 752 | 61.2 | +14.5 | |
| Liberal Democrat | Ian Metherell | 476 | 38.8 | -14.5 | |
| Majority | 276 | 22.4 | |||
| Turnout | 1,228 | 50 | |||
| Conservative gain from Liberal Democrat | Swing | ||||
| Party | Candidate | Votes | % | ± | |
|---|---|---|---|---|---|
| Conservative | Pam Pearce | 653 | 63.5 | +32.0 | |
| Liberal Democrat | Geoffrey Twiss | 375 | 36.5 | +20.6 | |
| Majority | 278 | 27.0 | |||
| Turnout | 1,028 | 53 | |||
| Conservative gain from Independent | Swing | ||||
| Party | Candidate | Votes | % | ± | |
|---|---|---|---|---|---|
| Liberal Democrat | Steve Patrick | 626 | |||
| Liberal Democrat | Glenda Reynolds | 581 | |||
| Conservative | Philip Turner | 418 | |||
| Conservative | Joseph Cook | 412 | |||
| Independent | Patrick Martin | 301 | |||
| UKIP | Aimee Gibson | 122 | |||
| Turnout | 2,460 | 33 | |||
| Liberal Democrat hold | Swing | ||||
| Liberal Democrat hold | Swing | ||||
| Party | Candidate | Votes | % | ± | |
|---|---|---|---|---|---|
| Liberal Democrat | Avril Davies | 775 | 69.6 | +0.8 | |
| Conservative | Brenda Jennings | 338 | 30.4 | -0.8 | |
| Majority | 437 | 39.2 | +1.6 | ||
| Turnout | 1,113 | 43 | |||
| Liberal Democrat hold | Swing | ||||
| Party | Candidate | Votes | % | ± | |
|---|---|---|---|---|---|
| Conservative | Sue Polhill | 630 | 69.4 | ||
| Labour | Tom Quinn | 143 | 15.7 | ||
| Liberal Democrat | Harold Newman | 135 | 14.9 | ||
| Majority | 487 | 53.7 | |||
| Turnout | 908 | 48 | |||
| Conservative hold | Swing | ||||
| Party | Candidate | Votes | % | ± | |
|---|---|---|---|---|---|
| Liberal Democrat | Ray Ghent | 412 | |||
| Liberal Democrat | Maria Butler | 348 | |||
| Conservative | Noreen O'Sullivan | 308 | |||
| Conservative | Wajid Kiani | 273 | |||
| UKIP | Chris Adams | 202 | |||
| Labour | Michael Beall | 168 | |||
| Labour | Gareth Bell | 134 | |||
| Turnout | 1,843 | 39 | |||
| Liberal Democrat hold | Swing | ||||
| Liberal Democrat hold | Swing | ||||
| Party | Candidate | Votes | % | ± | |
|---|---|---|---|---|---|
| Liberal Democrat | Freda Roberts | 703 | |||
| Liberal Democrat | David Ralph | 536 | |||
| Conservative | Mohammed Khalid | 298 | |||
| Conservative | Marion Dorrell | 289 | |||
| Labour | Zard Khan | 228 | |||
| UKIP | Gavin Richardson | 172 | |||
| Labour | Adrian Mumford-Smith | 137 | |||
| Turnout | 2,363 | 32 | |||
| Liberal Democrat hold | Swing | ||||
| Liberal Democrat hold | Swing | ||||
| Party | Candidate | Votes | % | ± | |
|---|---|---|---|---|---|
| Conservative | John Chilver | 373 | 46.3 | ||
| Independent | Edward Griffin | 229 | 28.4 | ||
| Independent | John Riches | 144 | 17.9 | ||
| Labour | Susannah Cox | 59 | 7.3 | ||
| Majority | 144 | 17.9 | |||
| Turnout | 805 | 37 | |||
| Conservative hold | Swing | ||||
| Party | Candidate | Votes | % | ± | |
|---|---|---|---|---|---|
| Conservative | Janet Blake | unopposed | |||
| Conservative hold | Swing | ||||
| Party | Candidate | Votes | % | ± | |
|---|---|---|---|---|---|
| Conservative | David Rowlands | 766 | 68.9 | -4.4 | |
| Labour | Paul Thomas | 225 | 20.3 | +20.3 | |
| Liberal Democrat | Lucy Monger | 120 | 10.8 | -15.9 | |
| Majority | 541 | 48.6 | +2.0 | ||
| Turnout | 1,111 | 47 | |||
| Conservative hold | Swing | ||||
| Party | Candidate | Votes | % | ± | |
|---|---|---|---|---|---|
| Conservative | Margaret Morgan-Owen | 455 | 48.6 | ||
| UKIP | Dave Fowler | 380 | 40.6 | ||
| Liberal Democrat | Gareth Davies | 102 | 10.9 | ||
| Majority | 75 | 8.0 | |||
| Turnout | 937 | 49 | |||
| Conservative hold | Swing | ||||
| Party | Candidate | Votes | % | ± | |
|---|---|---|---|---|---|
| Liberal Democrat | Steven Kennell | 626 | |||
| Liberal Democrat | Ranjula Takodra | 515 | |||
| Conservative | Moyra Marsh | 339 | |||
| Independent | Roger Priest | 297 | |||
| UKIP | John Wiseman | 260 | |||
| Conservative | Habib Afzal | 233 | |||
| Turnout | 2,270 | 31 | |||
| Liberal Democrat hold | Swing | ||||
| Liberal Democrat hold | Swing | ||||
| Party | Candidate | Votes | % | ± | |
|---|---|---|---|---|---|
| Conservative | Ashley Bond | 432 | 70.6 | +8.5 | |
| Labour | Maggie Ewan | 72 | 11.8 | -5.0 | |
| Liberal Democrat | Mary Baldwin | 66 | 10.8 | -10.3 | |
| UKIP | Mark Ferguson | 42 | 6.9 | +6.9 | |
| Majority | 360 | 58.8 | +17.8 | ||
| Turnout | 612 | 50 | |||
| Conservative hold | Swing | ||||
| Party | Candidate | Votes | % | ± | |
|---|---|---|---|---|---|
| Conservative | Chris Richards | 1,508 | |||
| Conservative | Kevin McPartland | 1,428 | |||
| Conservative | Richard Birchley | 1,396 | |||
| Liberal Democrat | John Hood | 803 | |||
| Liberal Democrat | Jane Rutland | 776 | |||
| Liberal Democrat | Eli Kling | 748 | |||
| UKIP | John Lesingham | 309 | |||
| Turnout | 6,968 | 42 | |||
| Conservative hold | Swing | ||||
| Conservative hold | Swing | ||||
| Conservative hold | Swing | ||||
| Party | Candidate | Votes | % | ± | |
|---|---|---|---|---|---|
| Conservative | Netta Glover | 604 | 71.9 | +6.8 | |
| Liberal Democrat | Michael Smith | 157 | 18.7 | -16.2 | |
| UKIP | Heather Adams | 79 | 9.4 | +9.4 | |
| Majority | 447 | 53.2 | +23.0 | ||
| Turnout | 840 | 39 | |||
| Conservative hold | Swing | ||||
| Party | Candidate | Votes | % | ± | |
|---|---|---|---|---|---|
| Independent | Peter Cooper | 538 | 57.9 | -6.7 | |
| Conservative | Rod Moulding | 283 | 30.5 | -4.9 | |
| Liberal Democrat | Clive Parish | 108 | 11.6 | +11.6 | |
| Majority | 255 | 27.4 | -1.8 | ||
| Turnout | 929 | 45 | |||
| Independent hold | Swing | ||||
| Party | Candidate | Votes | % | ± | |
|---|---|---|---|---|---|
| Conservative | Lindsay Rowlands | 1,121 | |||
| Conservative | Duncan Wigley | 987 | |||
| Liberal Democrat | Llew Monger | 697 | |||
| Labour | Shirley Millichip | 331 | |||
| UKIP | Paula Davies | 270 | |||
| Turnout | 3,406 | 43 | |||
| Conservative hold | Swing | ||||
| Conservative hold | Swing | ||||
External links
| Buckinghamshire County Council | |
|---|---|
| Milton Keynes Council | |
| Aylesbury Vale District Council | |
| Chiltern District Council |
|
| South Bucks District Council |
|
| Wycombe District Council |
|
| |
This article is issued from Wikipedia - version of the 12/4/2015. The text is available under the Creative Commons Attribution/Share Alike but additional terms may apply for the media files.