Balearic parliamentary election, 1983
Balearic parliamentary election, 1983

|
|
|
|
|

|
| Most voted party by district.
|
|
|
The 1983 Balearic parliamentary election was held on Sunday, 8 May 1983, to elect the 1st Parliament of the Balearic Islands, the unicameral regional legislature of the Spanish autonomous community of the Balearic Islands. All 54 seats in the Parliament were up for election, determining the President of the Balearic Islands.
The regional picture, at first glance, had been dominated by the Union of the Democratic Centre (UCD), having won the 1979 elections to the Island Councils and heading the pre-autonomic government since 1978. However, the UCD was dissolved in early 1983 after its disastrous defeat in the 1982 Spanish general election, with its supporters fleeing to the People's Alliance (AP), the People's Democratic Party (PDP) or, as one of its erstwhile leaders, the newly founded Majorcan Union (UM). Other parties which had also contested the Island Council elections four year previously were regional branch of the Spanish Socialist Workers' Party, the Socialist Party of Majorca or the Communist Party of the Balearic Islands. There was no electoral law passed, but the 1983 Statute of Autonomy did provide for a provisional distribution of seats per island until the community could have its own electoral law.
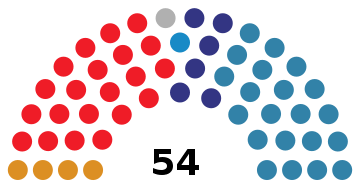
The Socialists won the islands of Majorca, Menorca and Formentera, but its lead over its competitors there was so small that the broad People's Coalition (AP–PDP–UL) victory in Ibiza provided for a centre-right narrow victory overall. The AP–PDP–UL coalition emerged as the largest force with 21 seats, followed closely by the PSOE with another 21 seats and UM with 6. The centre-right candidate, Gabriel Cañellas, was able to access the regional government thanks to support from UM, the Liberal Democratic Party (PDL) and the Minorcan Independent Candidacy (CIM).
Electoral system
As the community did not possess an electoral law of its own at the time, the electoral system came regulated by the regional Statute of Autonomy and the provisional legislation regulating general elections: Royal Law-Decree 20/1977, of 18 March. The number of seats in the Parliament was set to 54, with deputies being elected in 3 multi-member districts, each corresponding to one of the three largest islands in the archipelago: Majorca was entitled 30 seats; Menorca with 12 and Ibiza with 11. Additionally, Formentera elected one member using plurality voting. Seats were elected using the D'Hondt method and a closed-list proportional representation system, with an election threshold of 3% of valid votes for each district (which included blank ballots—for none of the above).
Results
Overall
|
Communist Party of the Balearic Islands (PCIB) |
7,669 | 2.47 | — |
0 | — |
|
Democratic and Social Centre (CDS) |
6,611 | 2.13 | — |
0 | — |
|
Liberal Democratic Party (PDL) |
3,896 | 1.25 | — |
1 | — |
|
Minorcan Independent Candidacy (CIM) |
3,250 | 1.05 | — |
1 | — |
|
Spanish Communist Workers' Party (PCOE) |
1,509 | 0.49 | — |
0 | — |
|
Blank ballots |
1,820 | 0.59 | — |
|
|
| Total |
310,916 | 100.00 | |
54 | — |
|
| Valid votes |
310,916 | 98.46 | — |
|
| Invalid votes |
4,879 | 1.54 | — |
| Votes cast / turnout |
315,795 | 64.67 | — |
| Abstentions |
172,541 | 35.33 | — |
| Registered voters |
488,336 | |
|
| Source: Government of the Balearic Islands |
| Vote share |
|---|
|
|
|
|
|
| AP–PDP–UL |
|
35.58% |
| PSOE |
|
34.71% |
| UM |
|
15.09% |
| PSI |
|
6.66% |
| PCIB |
|
2.47% |
| CDS |
|
2.13% |
| PDL |
|
1.25% |
| CIM |
|
1.05% |
| Others |
|
0.49% |
| Blank |
|
0.59% |
| Parliamentary seats |
|---|
|
|
|
|
|
| AP–PDP–UL |
|
38.89% |
| PSOE |
|
38.89% |
| UM |
|
11.11% |
| PSI |
|
7.41% |
| PDL |
|
1.85% |
| CIM |
|
1.85% |
Results by district
Summary of the 8 May 1983 Balearic Islands Parliament election results in Majorca →
| Party |
Popular vote |
Seats |
| Votes |
% |
±pp |
Won |
+/− |
|
Spanish Socialist Workers' Party (PSOE) |
88,771 | 34.66 | — |
11 | — |
|
People's Coalition (AP–PDP–UL) |
87,893 | 34.32 | — |
11 | — |
|
Majorcan Union (UM) |
46,915 | 18.32 | — |
6 | — |
|
Socialist Party of Majorca (PSM) |
16,979 | 6.63 | — |
2 | — |
|
|
Communist Party of the Balearic Islands (PCIB) |
6,525 | 2.55 | — |
0 | — |
|
Democratic and Social Centre (CDS) |
6,101 | 2.38 | — |
0 | — |
|
Spanish Communist Workers' Party (PCOE) |
1,509 | 0.59 | — |
0 | — |
|
Blank ballots |
1,437 | 0.56 | — |
|
|
| Total |
256,130 | 100.00 | |
30 | — |
|
| Valid votes |
256,130 | 98.42 | — |
|
| Invalid votes |
4,101 | 1.58 | — |
| Votes cast / turnout |
260,231 | 65.05 | — |
| Abstentions |
139,824 | 34.95 | — |
| Registered voters |
400,055 | |
|
| Source: Government of the Balearic Islands |
Post-election
Investiture vote
First round: 7 June 1983
Absolute majority (28/54) required
| Candidate: Gabriel Cañellas |
| Choice |
Vote |
| Parties |
Votes |
|
 Y Yes Y Yes |
AP–PDP–UL (21), UM (6), PDL (1), CIM (1) |
|
|
No |
PSOE (21), PSM (2), PSMe (2) |
|
|
Abstentions |
|
|
| Source: Historia Electoral |
References

.jpg)

