Harlow District Council election, 2006
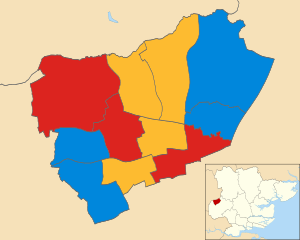
Map of the results of the 2006 Harlow District Council election. Liberal Democrats in yellow, Conservatives in blue and Labour in red.
The 2006 Harlow District Council election took place on 4 May 2006 to elect members of Harlow District Council in Essex, England. One third of the council was up for election and the council stayed under no overall control.[1]
After the election, the composition of the council was
- Conservative 12
- Labour 11
- Liberal Democrats 10[2]
Election result
Overall turnout at the election was 36.93%.[3]
| Harlow local election result 2006[2] | ||||||||||
|---|---|---|---|---|---|---|---|---|---|---|
| Party | Seats | Gains | Losses | Net gain/loss | Seats % | Votes % | Votes | +/− | ||
| Liberal Democrat | 5 | 1 | 0 | +1 | 41.7 | 25.8 | 5,606 | +4.0% | ||
| Conservative | 4 | 0 | 1 | -1 | 33.3 | 40.2 | 8,737 | +8.5% | ||
| Labour | 3 | 0 | 0 | 0 | 25.0 | 32.1 | 6,968 | -1.0% | ||
| Respect | 0 | 0 | 0 | 0 | 0 | 1.0 | 217 | +1.0% | ||
| Independent | 0 | 0 | 0 | 0 | 0 | 1.0 | 211 | -10.6% | ||
Ward results
| Party | Candidate | Votes | % | ± | |
|---|---|---|---|---|---|
| Liberal Democrat | Eleanor Macy | 995 | 48.7 | +16.6 | |
| Labour | Edna Stevens | 693 | 33.9 | -1.0 | |
| Conservative | Graham Smith | 357 | 17.5 | -0.3 | |
| Majority | 302 | 14.8 | |||
| Turnout | 2,045 | 39.1 | -1.1 | ||
| Liberal Democrat hold | Swing | ||||
| Party | Candidate | Votes | % | ± | |
|---|---|---|---|---|---|
| Conservative | Samantha Warren | 1,387 | 73.3 | +11.7 | |
| Labour | Kenneth Lawrie | 298 | 15.8 | +0.3 | |
| Liberal Democrat | Robert Pailing | 206 | 10.9 | -12.0 | |
| Majority | 1,089 | 57.5 | +18.8 | ||
| Turnout | 1,891 | 32.0 | +1.5 | ||
| Conservative hold | Swing | ||||
| Party | Candidate | Votes | % | ± | |
|---|---|---|---|---|---|
| Conservative | Joshua Jolles | 960 | 51.1 | +11.1 | |
| Labour | Norman Knight | 608 | 32.4 | +0.8 | |
| Liberal Democrat | Ian Rideout | 309 | 16.5 | +5.2 | |
| Majority | 352 | 18.7 | +10.3 | ||
| Turnout | 1,877 | 38.6 | -0.3 | ||
| Conservative hold | Swing | ||||
| Party | Candidate | Votes | % | ± | |
|---|---|---|---|---|---|
| Labour | Margaret Hulcoop | 789 | 40.2 | +1.1 | |
| Conservative | Michelle Dorling | 706 | 35.9 | +3.3 | |
| Liberal Democrat | Alan Lawrence | 258 | 13.1 | +0.1 | |
| Independent | Gary Roberts | 211 | 10.7 | -4.6 | |
| Majority | 83 | 4.3 | -2.2 | ||
| Turnout | 1,964 | 38.4 | +0.3 | ||
| Labour hold | Swing | ||||
| Party | Candidate | Votes | % | ± | |
|---|---|---|---|---|---|
| Labour | Anthony Durcan | 743 | 43.2 | -3.5 | |
| Conservative | Lee Dangerfield | 613 | 35.6 | +4.0 | |
| Liberal Democrat | Richard Farnsworth | 365 | 21.2 | -0.5 | |
| Majority | 130 | 7.6 | -7.5 | ||
| Turnout | 1,721 | 35.5 | -1.7 | ||
| Labour hold | Swing | ||||
| Party | Candidate | Votes | % | ± | |
|---|---|---|---|---|---|
| Liberal Democrat | Robert Thurston | 761 | 37.0 | +8.6 | |
| Labour | Michael Danvers | 735 | 35.7 | -4.2 | |
| Conservative | Jane Steer | 562 | 27.3 | +8.8 | |
| Majority | 26 | 1.3 | |||
| Turnout | 2,058 | 43.7 | +0.8 | ||
| Liberal Democrat gain from Conservative | Swing | ||||
| Party | Candidate | Votes | % | ± | |
|---|---|---|---|---|---|
| Liberal Democrat | Linda Pailing | 736 | 42.3 | +8.2 | |
| Labour | Feroz Khan | 555 | 31.9 | +7.6 | |
| Conservative | Valerie Gough | 448 | 25.8 | +11.7 | |
| Majority | 181 | 10.4 | +0.6 | ||
| Turnout | 1,739 | 35.5 | -0.9 | ||
| Liberal Democrat hold | Swing | ||||
| Party | Candidate | Votes | % | ± | |
|---|---|---|---|---|---|
| Conservative | Michael Garnett | 1,033 | 56.5 | +18.8 | |
| Labour | Paul Sztumpf | 477 | 26.1 | +1.1 | |
| Liberal Democrat | Nicholas Macy | 318 | 17.4 | +6.9 | |
| Majority | 556 | 30.4 | +19.6 | ||
| Turnout | 1,828 | 39.1 | -3.3 | ||
| Conservative hold | Swing | ||||
| Party | Candidate | Votes | % | ± | |
|---|---|---|---|---|---|
| Liberal Democrat | Lorna Spenceley | 629 | |||
| Liberal Democrat | Christopher Robins | 595 | |||
| Conservative | Clive Souter | 536 | |||
| Conservative | Mark Gough | 534 | |||
| Labour | Dennis Palmer | 388 | |||
| Labour | Jenny Holland | 386 | |||
| Turnout | 3,068 | ||||
| Liberal Democrat hold | Swing | ||||
| Liberal Democrat hold | Swing | ||||
| Party | Candidate | Votes | % | ± | |
|---|---|---|---|---|---|
| Conservative | Nicholas Churchill | 842 | 54.0 | +8.0 | |
| Labour | Suzanne Ennifer | 484 | 31.1 | -5.5 | |
| Liberal Democrat | Kuzna Jackson | 232 | 14.9 | -2.4 | |
| Majority | 358 | 22.9 | +13.5 | ||
| Turnout | 1,558 | 31.0 | -2.5 | ||
| Conservative hold | Swing | ||||
| Party | Candidate | Votes | % | ± | |
|---|---|---|---|---|---|
| Labour | Roy Collyer | 812 | 40.8 | -1.4 | |
| Conservative | David Carter | 759 | 38.1 | +8.8 | |
| Respect | James Rogers | 217 | 10.9 | +10.9 | |
| Liberal Democrat | Paul Westlake | 202 | 10.2 | -2.1 | |
| Majority | 53 | 2.7 | -10.2 | ||
| Turnout | 1,990 | 40.6 | +5.2 | ||
| Labour hold | Swing | ||||
References
- ↑ "Local elections: Harlow". BBC News Online. 5 May 2006. Retrieved 1 January 2015.
- 1 2 3 4 5 6 7 8 9 10 11 12 13 "Harlow District Council Election Results 2006". Harlow District Council. Archived from the original on 6 February 2012. Retrieved 1 January 2015.
- ↑ "Election Results 3rd May 2007". Harlow District Council. Archived from the original on 6 February 2012. Retrieved 1 January 2015.
This article is issued from Wikipedia - version of the 3/14/2015. The text is available under the Creative Commons Attribution/Share Alike but additional terms may apply for the media files.