Wirral Metropolitan Borough Council election, 2006
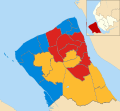
Map of the results of the 2006 Wirral council election. Labour in red, Conservatives in blue and Liberal Democrats in yellow.
Elections to Wirral Metropolitan Borough Council were held on 4 May 2006. One third of the council was up for election and the council stayed under no overall control. Overall turnout was 35.2%.
After the election, the composition of the council was
- Labour 26
- Conservative 21
- Liberal Democrat 19
Election result
| Wirral Local Election Result 2006 | ||||||||||
|---|---|---|---|---|---|---|---|---|---|---|
| Party | Seats | Gains | Losses | Net gain/loss | Seats % | Votes % | Votes | +/− | ||
| Labour | 8 | 1 | 1 | 0 | 36.4 | 27.5 | 23,487 | -3.1% | ||
| Conservative | 7 | 2 | 2 | 0 | 31.8 | 37.3 | 31,839 | +1.6% | ||
| Liberal Democrat | 7 | 1 | 0 | +1 | 31.8 | 27.1 | 23,066 | -3.4% | ||
| Green | 0 | 0 | 0 | 0 | 0 | 6.3 | 5,389 | +3.9% | ||
| UKIP | 0 | 0 | 1 | -1 | 0 | 1.0 | 879 | +1.0% | ||
| Wirral Independent Network | 0 | 0 | 0 | 0 | 0 | 0.4 | 318 | -0.2% | ||
| BNP | 0 | 0 | 0 | 0 | 0 | 0.3 | 282 | +0.2% | ||
Ward results
| Party | Candidate | Votes | % | ± | |
|---|---|---|---|---|---|
| Labour | Walter Smith | 1,730 | 35.4 | ||
| Conservative | Leslie Thomas | 1,599 | 32.7 | ||
| Liberal Democrat | Christopher Jackson | 898 | 18.4 | ||
| UKIP | Hilary Jones | 446 | 9.1 | ||
| Green | Michael Harper | 218 | 4.5 | ||
| Majority | 131 | 2.7 | |||
| Turnout | 4,891 | 41.2 | -8.0 | ||
| Labour gain from Conservative | Swing | ||||
| Party | Candidate | Votes | % | ± | |
|---|---|---|---|---|---|
| Labour | Ann McLachlan | 1,307 | 63.7 | ||
| Conservative | Barbara Sinclair | 293 | 14.3 | ||
| Liberal Democrat | Roy Wood | 292 | 14.2 | ||
| Green | George Bowler | 161 | 7.8 | ||
| Majority | 1,014 | 49.4 | |||
| Turnout | 2,053 | 20.5 | -6.7 | ||
| Labour hold | Swing | ||||
| Party | Candidate | Votes | % | ± | |
|---|---|---|---|---|---|
| Labour | Brian Kenny | 1,119 | 53.2 | ||
| Wirral Independent Network | Andrew Dow | 318 | 15.1 | ||
| Liberal Democrat | Alan Brighouse | 303 | 14.4 | ||
| Conservative | June Cowin | 193 | 9.2 | ||
| Green | Catherine Page | 170 | 8.1 | ||
| Majority | 801 | 38.1 | |||
| Turnout | 2,103 | 20.9 | -6.1 | ||
| Labour hold | Swing | ||||
| Party | Candidate | Votes | % | ± | |
|---|---|---|---|---|---|
| Liberal Democrat | Alan Taylor | 1,827 | 53.3 | ||
| Labour | Audrey Moore | 924 | 27.0 | ||
| Conservative | Jonathan Mackie | 487 | 14.2 | ||
| Green | Ann Jones | 190 | 5.5 | ||
| Majority | 903 | 26.3 | |||
| Turnout | 3,428 | 32.0 | -9.6 | ||
| Liberal Democrat hold | Swing | ||||
| Party | Candidate | Votes | % | ± | |
|---|---|---|---|---|---|
| Liberal Democrat | Christopher Teggin | 2,354 | 45.3 | ||
| Conservative | Irene Povall | 1,978 | 38.0 | ||
| Labour | Andrew Page | 702 | 13.5 | ||
| Green | Khalid Hussenbux | 168 | 3.2 | ||
| Majority | 376 | 7.3 | |||
| Turnout | 5,202 | 44.1 | -8.8 | ||
| Liberal Democrat hold | Swing | ||||
| Party | Candidate | Votes | % | ± | |
|---|---|---|---|---|---|
| Labour | Denise Roberts | 1,590 | 49.3 | ||
| Conservative | Peter Hartley | 879 | 27.3 | ||
| Liberal Democrat | Anna Blumenthal | 531 | 16.5 | ||
| Green | Joyce Hogg | 223 | 6.9 | ||
| Majority | 711 | 22.0 | |||
| Turnout | 3,223 | 28.3 | -12.1 | ||
| Labour hold | Swing | ||||
| Party | Candidate | Votes | % | ± | |
|---|---|---|---|---|---|
| Liberal Democrat | Thomas Harney | 2,924 | 68.4 | ||
| Conservative | Barbara Green | 637 | 14.9 | ||
| Labour | Christopher Lawler | 559 | 13.1 | ||
| Green | Brian Gibbs | 155 | 3.6 | ||
| Majority | 2,287 | 53.5 | |||
| Turnout | 4,275 | 38.7 | -9.7 | ||
| Liberal Democrat hold | Swing | ||||
| Party | Candidate | Votes | % | ± | |
|---|---|---|---|---|---|
| Liberal Democrat | Jean Quinn | 2,690 | 48.9 | ||
| Conservative | Kenneth Young | 2,032 | 36.9 | ||
| Labour | Barbara Moores | 591 | 10.7 | ||
| Green | Anne Rosseinsky | 193 | 3.5 | ||
| Majority | 658 | 12.0 | |||
| Turnout | 5,506 | 47.5 | -5.7 | ||
| Liberal Democrat hold | Swing | ||||
| Party | Candidate | Votes | % | ± | |
|---|---|---|---|---|---|
| Conservative | Stephen Rowlands | 3,412 | 69.6 | ||
| Liberal Democrat | William Jones | 600 | 12.2 | ||
| Labour | Philip Waterfield | 544 | 11.1 | ||
| Green | Ian Barclay | 348 | 7.1 | ||
| Majority | 2,812 | 57.4 | |||
| Turnout | 4,904 | 44.5 | -10.8 | ||
| Conservative hold | Swing | ||||
| Party | Candidate | Votes | % | ± | |
|---|---|---|---|---|---|
| Conservative | David Kirwan | 2,509 | 59.0 | ||
| Labour | Stuart Wade | 765 | 18.0 | ||
| Liberal Democrat | Sarah Quinn | 605 | 14.2 | ||
| Green | Hara Willow | 377 | 8.9 | ||
| Majority | 1,744 | 41.0 | |||
| Turnout | 4,256 | 40.2 | -9.8 | ||
| Conservative gain from UKIP | Swing | ||||
| Party | Candidate | Votes | % | ± | |
|---|---|---|---|---|---|
| Labour | Iris Coates | 1,426 | 45.6 | ||
| Conservative | Vida Wilson | 1,050 | 33.6 | ||
| Liberal Democrat | Gerald Hainsworth | 406 | 13.0 | ||
| Green | Rosemary Bland | 243 | 7.8 | ||
| Majority | 376 | 12.0 | |||
| Turnout | 3,125 | 28.6 | -8.4 | ||
| Labour hold | Swing | ||||
| Party | Candidate | Votes | % | ± | |
|---|---|---|---|---|---|
| Conservative | Leah Fraser | 2,047 | 49.9 | ||
| Labour | Christine Jones | 1,396 | 34.0 | ||
| Liberal Democrat | Susan Uriel | 286 | 7.0 | ||
| Green | Lucinda Richardson | 209 | 5.1 | ||
| UKIP | Philip Griffiths | 166 | 4.0 | ||
| Majority | 651 | 15.9 | |||
| Turnout | 4,104 | 36.4 | -2.8 | ||
| Conservative gain from Labour | Swing | ||||
| Party | Candidate | Votes | % | ± | |
|---|---|---|---|---|---|
| Conservative | Simon Mountney | 2,154 | 57.0 | ||
| Labour | Darren Dodd | 973 | 25.7 | ||
| Liberal Democrat | Eric Copestake | 401 | 10.6 | ||
| Green | James Drew | 251 | 6.6 | ||
| Majority | 1,181 | 21.3 | |||
| Turnout | 3,779 | 34.7 | -8.9 | ||
| Conservative hold | Swing | ||||
| Party | Candidate | Votes | % | ± | |
|---|---|---|---|---|---|
| Conservative | William Duffy | 1,622 | 41.8 | ||
| Labour | Elizabeth McArdle | 1,236 | 31.8 | ||
| Green | Cynthia Stonall | 546 | 14.1 | ||
| Liberal Democrat | Matthew Byrne | 479 | 12.3 | ||
| Majority | 386 | 10.0 | |||
| Turnout | 3,883 | 35.3 | -6.1 | ||
| Conservative hold | Swing | ||||
| Party | Candidate | Votes | % | ± | |
|---|---|---|---|---|---|
| Liberal Democrat | Paula Southwood | 2,067 | 55.4 | ||
| Labour | David Barden | 646 | 17.3 | ||
| Conservative | Tina McDonnell | 565 | 15.1 | ||
| UKIP | Michael Pepler | 267 | 7.2 | ||
| Green | Garnette Bowler | 185 | 5.0 | ||
| Majority | 1,421 | 38.1 | |||
| Turnout | 3,730 | 33.4 | -9.3 | ||
| Liberal Democrat hold | Swing | ||||
| Party | Candidate | Votes | % | ± | |
|---|---|---|---|---|---|
| Liberal Democrat | Michael Redfern | 1,843 | 40.4 | ||
| Conservative | Oliver Adam | 1,710 | 37.5 | ||
| Labour | John Cunningham | 754 | 16.5 | ||
| Green | Allen Burton | 256 | 5.6 | ||
| Majority | 133 | 2.9 | |||
| Turnout | 4,563 | 42.6 | -7.5 | ||
| Liberal Democrat gain from Conservative | Swing | ||||
| Party | Candidate | Votes | % | ± | |
|---|---|---|---|---|---|
| Liberal Democrat | Francis Doyle | 1,558 | 41.5 | ||
| Labour | Denise Realey | 1,215 | 32.3 | ||
| Conservative | Susan Percy | 753 | 20.0 | ||
| Green | Mark Mitchell | 232 | 6.2 | ||
| Majority | 343 | 9.2 | |||
| Turnout | 3,758 | 34.2 | -10.2 | ||
| Liberal Democrat hold | Swing | ||||
| Party | Candidate | Votes | % | ± | |
|---|---|---|---|---|---|
| Labour | Moira McLaughlin | 1,405 | 58.0 | ||
| Liberal Democrat | Peter Heppinstall | 405 | 16.7 | ||
| Conservative | Joanne Suffield | 404 | 16.7 | ||
| Green | Anna Stamp | 207 | 8.6 | ||
| Majority | 1,000 | 41.3 | |||
| Turnout | 2,421 | 23.8 | -6.7 | ||
| Labour hold | Swing | ||||
| Party | Candidate | Votes | % | ± | |
|---|---|---|---|---|---|
| Labour | Adrian Jones | 1,341 | 58.2 | ||
| Conservative | Robert Sherlock | 413 | 17.9 | ||
| Liberal Democrat | Terence Pitt | 344 | 14.9 | ||
| Green | Beverley Kells | 205 | 8.9 | ||
| Majority | 928 | 40.3 | |||
| Turnout | 2,303 | 22.2 | -7.3 | ||
| Labour hold | Swing | ||||
| Party | Candidate | Votes | % | ± | |
|---|---|---|---|---|---|
| Labour | John George | 1,716 | 39.1 | ||
| Conservative | Julie Kirwan | 1,424 | 32.4 | ||
| Liberal Democrat | Robert Earl | 991 | 22.6 | ||
| Green | Lesley Hussenbux | 262 | 6.0 | ||
| Majority | 292 | 6.7 | |||
| Turnout | 4,393 | 36.2 | -4.4 | ||
| Labour hold | Swing | ||||
| Party | Candidate | Votes | % | ± | |
|---|---|---|---|---|---|
| Conservative | Lesley Rennie | 2,907 | 59.1 | ||
| Labour | James Crabtree | 957 | 19.5 | ||
| Liberal Democrat | John Uriel | 546 | 11.1 | ||
| BNP | John Edwards | 282 | 5.7 | ||
| Green | Perle Sheldricks | 228 | 4.6 | ||
| Majority | 1,950 | 39.6 | |||
| Turnout | 4,920 | 41.1 | -7.2 | ||
| Conservative hold | Swing | ||||
| Party | Candidate | Votes | % | ± | |
|---|---|---|---|---|---|
| Conservative | Jeffrey Green | 2,771 | 62.4 | ||
| Liberal Democrat | Christopher Beazer | 716 | 16.1 | ||
| Labour | James Brown | 591 | 13.3 | ||
| Green | Patrick Cleary | 362 | 8.2 | ||
| Majority | 2,055 | 46.3 | |||
| Turnout | 4,440 | 42.9 | -11.7 | ||
| Conservative hold | Swing | ||||
External links
This article is issued from Wikipedia - version of the 2/24/2015. The text is available under the Creative Commons Attribution/Share Alike but additional terms may apply for the media files.