Hyndburn Borough Council election, 2012

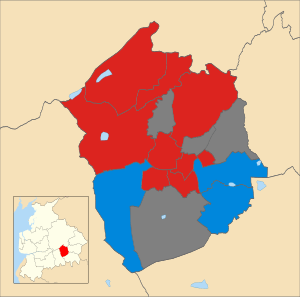
Map of Hyndburn, Lancashire, UK showing the results of the 2012 local election. Labour in red and Conservatives in blue. Wards in dark grey were not contested in 2012.
Elections to Hyndburn Borough Councill were held on Thursday, 3 May 2012. One third of the council was up for election and the Labour party increased its overall control of the council with an eleven-seat majority.
After the election, the composition of the council was
- Conservative 9
- Labour 23
- Independent 3
Election result
Hyndburn Local Election Result 2012 | ||||||||||
---|---|---|---|---|---|---|---|---|---|---|
Party | Seats | Gains | Losses | Net gain/loss | Seats % | Votes % | Votes | +/− | ||
Labour | 9 | 5 | 0 | 5 | 65.7 | 55.91 | 9351 | 2240 | ||
Conservative | 3 | 0 | 4 | -4 | 25.7 | 35.19 | 5885 | -2593 | ||
Independents in Hyndburn | 0 | 0 | 1 | -1 | 8.6 | 3.82 | 639 | 242 | ||
UKIP | 0 | 0 | 0 | 0 | 0 | 3.77 | 630 | N/A | ||
Liberal Democrat | 0 | 0 | 0 | 0 | 0 | 1.32 | 220 | -597 | ||
NB: Four (of the 16) Council ward seats that were NOT up for re-election in 2012 included the following wards - Clayton Le Moors, Huncoat, Immanuel in Oswaldtwistle and Milnshaw in Accrington.
Ward results
Party | Candidate | Votes | % | ± | |
---|---|---|---|---|---|
Labour | Chris FISHER | 733 | 62.12 | 14.52 | |
Conservative | Marion RAYNOR | 251 | 21.27 | -31.13 | |
Independents in Hyndburn | John HODGKISS | 196 | 16.61 | N/A | |
Majority | 482 | 40.85 | N/A | ||
Turnout | 1,180 | TBC | |||
Labour gain from Conservative | Swing | ||||
Party | Candidate | Votes | % | ± | |
---|---|---|---|---|---|
Conservative | Tony DOBSON | 770 | 54.88 | -10.02 | |
Labour | Joyce PLUMMER | 609 | 43.41 | 22.71 | |
Liberal Democrat | Richard KELLY | 24 | 1.71 | N/A | |
Majority | 161 | 11.48 | N/A | ||
Turnout | 1,403 | TBC | |||
Conservative hold | Swing | ||||
Party | Candidate | Votes | % | ± | |
---|---|---|---|---|---|
Conservative | Terry HURN | 726 | 64.42 | -6.58 | |
Labour | David HARTLEY | 401 | 35.58 | 16.98 | |
Majority | 325 | 28.84 | N/A | ||
Turnout | 1,127 | TBC | |||
Conservative hold | Swing | ||||
Party | Candidate | Votes | % | ± | |
---|---|---|---|---|---|
Labour | Abdul KHAN | 1163 | 57.83 | 26.63 | |
Conservative | Allah DAD | 848 | 42.17 | 0.27 | |
Majority | 213 | 15.66 | N/A | ||
Turnout | 2,011 | TBC | |||
Labour gain from Conservative | Swing | ||||
Party | Candidate | Votes | % | ± | |
---|---|---|---|---|---|
Labour | Joan SMITH | 710 | 58.58 | 1.28 | |
Conservative | Basharat KHAN | 325 | 26.82 | -15.88 | |
Independent | Malcolm PRITCHARD | 141 | 11.63 | N/A | |
Liberal Democrat | Stephen TALBOT | 36 | 2.97 | N/A | |
Majority | 385 | 31.77 | N/A | ||
Turnout | 1,212 | TBC | |||
Labour hold | Swing | ||||
Party | Candidate | Votes | % | ± | |
---|---|---|---|---|---|
Labour | Noordad AZIZ | 834 | 65.26 | 32.56 | |
Conservative | Lynn WILSON | 444 | 34.74 | -2.26 | |
Majority | 390 | 30.52 | N/A | ||
Turnout | 1,278 | TBC | |||
Labour gain from Conservative | Swing | ||||
Party | Candidate | Votes | % | ± | |
---|---|---|---|---|---|
Labour | Kerry MOLINEUX | 868 | 45.80 | 1.3 | |
Conservative | Peter CLARKE | 387 | 20.42 | -35.08 | |
Independent | John DUCKWORTH | 317 | 16.73 | N/A | |
UKIP | Graham DAVIDSON | 224 | 11.82 | N/A | |
Great Harwood Independents | Jamie GLOVER | 99 | 5.22 | N/A | |
Majority | 481 | 25.38 | N/A | ||
Turnout | 1,895 | TBC | |||
Labour gain from Conservative | Swing | ||||
Party | Candidate | Votes | % | ± | |
---|---|---|---|---|---|
Labour | Wendy DWYER | 570 | 67.70 | -4.0 | |
Independents in Hyndburn | Paul BROWN | 272 | 32.30 | N/A | |
Majority | 298 | 35.39 | N/A | ||
Turnout | 842 | TBC | |||
Labour hold | Swing | ||||
Party | Candidate | Votes | % | ± | |
---|---|---|---|---|---|
Labour | Harry GRAYSON | 1374 | 71.30 | 8.5 | |
Conservative | Warren MELIA | 553 | 28.70 | -8.5 | |
Majority | 821 | 42.61 | N/A | ||
Turnout | 1,927 | TBC | |||
Labour hold | Swing | ||||
Party | Candidate | Votes | % | ± | |
---|---|---|---|---|---|
Labour | Munsif DAD | 940 | 60.22 | 2.32 | |
Conservative | Mohammed YOUNIS | 400 | 25.62 | -16.48 | |
Independents in Hyndburn | Kenneth SMITH | 171 | 10.95 | N/A | |
Liberal Democrat | Kim FURNESS | 50 | 3.20 | N/A | |
Majority | 540 | 34.59 | N/A | ||
Turnout | 1,561 | TBC | |||
Labour hold | Swing | ||||
Party | Candidate | Votes | % | ± | |
---|---|---|---|---|---|
Labour | Bill PINDER | 543 | 52.62 | 25.12 | |
Conservative | Brian WALMSLEY | 489 | 47.38 | -12.02 | |
Majority | 53 | 5.14 | N/A | ||
Turnout | 1,032 | TBC | |||
Labour gain from Conservative | Swing | ||||
Party | Candidate | Votes | % | ± | |
---|---|---|---|---|---|
Conservative | Marlene HAWORTH | 692 | 40.61 | -25.59 | |
Labour | Stewart EAVES | 606 | 35.56 | 1.76 | |
UKIP | Paul THOMPSON | 406 | 23.83 | N/A | |
Majority | 86 | 5.05 | N/A | ||
Turnout | 1,704 | TBC | |||
Conservative hold | Swing | ||||
References
- ↑ "Hyndburn Borough Council Local Elections 2012 - Results". Hyndburn Borough Council. Retrieved 5 May 2012.
http://www.bbc.co.uk/news/special/vote2012/council/E07000120.stm
This article is issued from Wikipedia - version of the 5/11/2016. The text is available under the Creative Commons Attribution/Share Alike but additional terms may apply for the media files.