Portsmouth City Council election, 2003
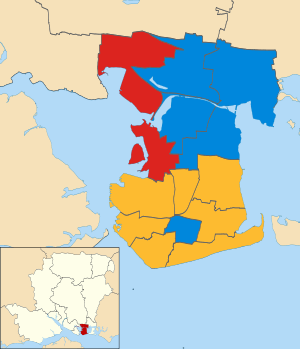
Map of the results of the 2003 Portsmouth council election. Liberal Democrats in yellow, Conservatives in blue and Labour in red.
Elections to Portsmouth City Council were held on 1 May 2003. One third of the council was up for election and the council stayed under no overall control. Overall turnout was 26.6%.
After the election, the composition of the council was
- Liberal Democrat 16
- Conservative 15
- Labour 11
Election result
| Portsmouth Local Election Result 2003 | ||||||||||
|---|---|---|---|---|---|---|---|---|---|---|
| Party | Seats | Gains | Losses | Net gain/loss | Seats % | Votes % | Votes | +/− | ||
| Liberal Democrat | 7 | 3 | 0 | +3 | 50.0 | 35.3 | 13,281 | +5.6% | ||
| Conservative | 5 | 2 | 2 | 0 | 35.7 | 36.5 | 13,738 | -1.1% | ||
| Labour | 2 | 0 | 3 | -3 | 14.3 | 26.0 | 9,798 | -5.2% | ||
| Green | 0 | 0 | 0 | 0 | 0 | 1.0 | 360 | +0.3% | ||
| Independent | 0 | 0 | 0 | 0 | 0 | 0.7 | 254 | +0.4% | ||
| Socialist Alliance | 0 | 0 | 0 | 0 | 0 | 0.5 | 193 | +0.1% | ||
Ward results
| Party | Candidate | Votes | % | ± | |
|---|---|---|---|---|---|
| Liberal Democrat | Geoffrey Goble | 1,638 | 50.1 | ||
| Conservative | Neil Pettigrew | 1,055 | 32.2 | ||
| Labour | Simon Bramwell | 434 | 13.3 | ||
| Green | Sarah Coote | 145 | 4.4 | ||
| Majority | 583 | 17.9 | |||
| Turnout | 3,272 | 32.1 | |||
| Liberal Democrat hold | Swing | ||||
| Party | Candidate | Votes | % | ± | |
|---|---|---|---|---|---|
| Conservative | Deborah Tomes | 1,271 | 41.2 | ||
| Labour | Mark Button | 1,118 | 36.2 | ||
| Liberal Democrat | Edward Couldwell | 575 | 18.6 | ||
| Socialist Alliance | Timothy Evans | 121 | 3.9 | ||
| Majority | 153 | 5.0 | |||
| Turnout | 3,085 | 28.3 | |||
| Conservative gain from Labour | Swing | ||||
| Party | Candidate | Votes | % | ± | |
|---|---|---|---|---|---|
| Liberal Democrat | Steven Wylie | 1,123 | 46.4 | ||
| Labour | John McIntyre | 874 | 36.1 | ||
| Conservative | Andrew Pursglove | 333 | 13.7 | ||
| Independent | Roland Woods | 92 | 3.8 | ||
| Majority | 249 | 10.3 | |||
| Turnout | 2,422 | 23.1 | |||
| Liberal Democrat gain from Labour | Swing | ||||
| Party | Candidate | Votes | % | ± | |
|---|---|---|---|---|---|
| Conservative | Alan Langford | 1,118 | 47.5 | ||
| Labour | Barbara Sparrow | 761 | 32.3 | ||
| Liberal Democrat | Jennifer Evans | 477 | 20.2 | ||
| Majority | 357 | 15.2 | |||
| Turnout | 2,356 | 23.5 | |||
| Conservative hold | Swing | ||||
| Party | Candidate | Votes | % | ± | |
|---|---|---|---|---|---|
| Conservative | Lee Mason | 1,048 | 40.6 | ||
| Labour | Stephen Reid | 936 | 36.3 | ||
| Liberal Democrat | Alan Webb | 596 | 23.1 | ||
| Majority | 108 | 4.3 | |||
| Turnout | 2,580 | 26.3 | |||
| Conservative gain from Labour | Swing | ||||
| Party | Candidate | Votes | % | ± | |
|---|---|---|---|---|---|
| Conservative | Robin Sparshatt | 1,848 | 51.5 | ||
| Liberal Democrat | Patrick Whittle | 1,157 | 32.3 | ||
| Labour | Sonia Relf | 582 | 16.2 | ||
| Majority | 691 | 19.2 | |||
| Turnout | 3,587 | 36.6 | |||
| Conservative hold | Swing | ||||
| Party | Candidate | Votes | % | ± | |
|---|---|---|---|---|---|
| Liberal Democrat | Frederick Charlton | 1,410 | 48.6 | ||
| Conservative | Nicholas Lacey | 1,070 | 36.9 | ||
| Labour | June Clarkson | 419 | 14.5 | ||
| Majority | 340 | 11.7 | |||
| Turnout | 2,899 | 28.6 | |||
| Liberal Democrat hold | Swing | ||||
| Party | Candidate | Votes | % | ± | |
|---|---|---|---|---|---|
| Liberal Democrat | Eleanor Scott | 1,102 | 52.6 | ||
| Labour | Beverley Hancock | 545 | 26.0 | ||
| Conservative | Peter Ross | 450 | 21.5 | ||
| Majority | 557 | 26.6 | |||
| Turnout | 2,097 | 20.2 | |||
| Liberal Democrat hold | Swing | ||||
| Party | Candidate | Votes | % | ± | |
|---|---|---|---|---|---|
| Conservative | Alistair Thompson | 1,281 | 45.1 | ||
| Labour | John Ferrett | 1,126 | 39.6 | ||
| Liberal Democrat | Hugh Mason | 435 | 15.3 | ||
| Majority | 155 | 5.5 | |||
| Turnout | 2,842 | 28.5 | |||
| Conservative hold | Swing | ||||
| Party | Candidate | Votes | % | ± | |
|---|---|---|---|---|---|
| Liberal Democrat | Robert Vernon-Jackson | 1,547 | 51.3 | ||
| Conservative | Gerald Shimbart | 822 | 27.3 | ||
| Labour | Kenneth Ferrett | 372 | 12.3 | ||
| Independent | Nigel Sizer | 162 | 5.4 | ||
| Green | Andrea Smith | 112 | 3.7 | ||
| Majority | 725 | 24.0 | |||
| Turnout | 3,015 | 31.7 | |||
| Liberal Democrat hold | Swing | ||||
| Party | Candidate | Votes | % | ± | |
|---|---|---|---|---|---|
| Labour | Leo Madden | 987 | 46.5 | ||
| Conservative | Selina Corkerton | 717 | 33.8 | ||
| Liberal Democrat | James Bowden | 417 | 19.7 | ||
| Majority | 270 | 12.7 | |||
| Turnout | 2,121 | 20.5 | |||
| Labour hold | Swing | ||||
| Party | Candidate | Votes | % | ± | |
|---|---|---|---|---|---|
| Labour | David Horne | 1,012 | 51.0 | ||
| Conservative | Luke Stubbs | 659 | 33.2 | ||
| Liberal Democrat | Michael Price | 211 | 10.6 | ||
| Green | Brian Bundy | 103 | 5.2 | ||
| Majority | 353 | 17.8 | |||
| Turnout | 1,985 | 19.7 | |||
| Labour hold | Swing | ||||
| Party | Candidate | Votes | % | ± | |
|---|---|---|---|---|---|
| Liberal Democrat | David Butler | 1,106 | 45.3 | ||
| Conservative | Malcolm Chewter | 1,033 | 42.3 | ||
| Labour | Matthew Gummerson | 304 | 12.4 | ||
| Majority | 73 | 3.0 | |||
| Turnout | 2,443 | 25.9 | |||
| Liberal Democrat gain from Conservative | Swing | ||||
| Party | Candidate | Votes | % | ± | |
|---|---|---|---|---|---|
| Liberal Democrat | Leslie Stevens | 1,487 | 50.9 | ||
| Conservative | Elaine Shimbart | 1,033 | 35.4 | ||
| Labour | Alwin Oliver | 328 | 11.2 | ||
| Socialist Alliance | Paul Thatcher | 72 | 2.5 | ||
| Majority | 454 | 15.5 | |||
| Turnout | 2,920 | 28.3 | |||
| Liberal Democrat gain from Conservative | Swing | ||||
References
| Preceded by Portsmouth City Council election, 2002 |
Portsmouth City Council elections | Succeeded by Portsmouth City Council election, 2004 |
| Metropolitan boroughs |
|
|---|---|
| Unitary authorities |
|
| District councils (England) |
|
| Scottish councils |
|
| National Assembly elections | |
This article is issued from Wikipedia - version of the 12/5/2015. The text is available under the Creative Commons Attribution/Share Alike but additional terms may apply for the media files.