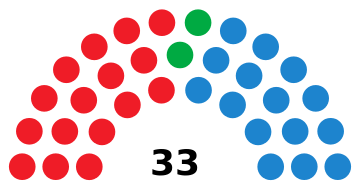
Riojan parliamentary election, 1991
| | |||||||||||||||||||||||||||||||||||||||||||||||||||||||||||||||
| |||||||||||||||||||||||||||||||||||||||||||||||||||||||||||||||
| |||||||||||||||||||||||||||||||||||||||||||||||||||||||||||||||
| |||||||||||||||||||||||||||||||||||||||||||||||||||||||||||||||
The 1991 Riojan parliamentary election was held on Sunday, 26 May 1991, to elect the 3rd Parliament of La Rioja, the regional legislature of the Spanish autonomous community of La Rioja. At stake were all 33 seats in the Parliament, determining the President of La Rioja.
The election was won again by the Spanish Socialist Workers' Party (PSOE), which increased its size and obtained 16 seats, one short for an overall majority. The Democratic and Social Centre (CDS) did not reach the required 5% threshold and lost all its seats, in benefit of the newly founded People's Party (PP) (AP new incarnation), which won two additional seats for a total of 5. United Left remained 0.5 percentage points short of entering the Parliament, while the Riojan Party (PR) was able to maintain its 2 seats despite not being able to halt its long-term decline.
As a result of the election, incumbent regional premier and PSOE leader José Ignacio Pérez Sáenz was able to get re-elected for a full term in office, after he was elected to the post in January 1990 through a motion of confidence against the former President, Joaquín Espert from AP/PP.
Electoral system
The number of seats in the Parliament of La Rioja was set to a fixed-number of 33. All Parliament members were elected in a single multi-member district, consisting of the Community's territory (the province of La Rioja), using the D'Hondt method and a closed-list proportional representation system.
Voting was on the basis of universal suffrage in a secret ballot. Only lists polling above 5% of valid votes in all of the community (which include blank ballots—for none of the above) were entitled to enter the seat distribution.[1]
Results
 | ||||||
| Party | Vote | Seats | ||||
|---|---|---|---|---|---|---|
| Votes | % | ±pp | Won | +/− | ||
| Spanish Socialist Workers' Party (PSOE) | 60,843 | 42.37 | |
16 | | |
| People's Party (PP)[lower-alpha 1] | 59,876 | 41.70 | |
15 | | |
| Riojan Party (PR) | 7,731 | 5.38 | |
2 | ±0 | |
| United Left (IU) | 6,499 | 4.53 | |
0 | ±0 | |
| Democratic and Social Centre (CDS) | 6,271 | 4.37 | |
0 | | |
| Blank ballots | 2,373 | 1.65 | |
|||
| Total | 143,593 | 100.00 | 33 | ±0 | ||
| Valid votes | 143,593 | 99.22 | |
|||
| Invalid votes | 1,136 | 0.78 | | |||
| Votes cast / turnout | 144,729 | 68.96 | | |||
| Abstentions | 65,137 | 31.04 | | |||
| Registered voters | 209,866 | |||||
| Source: Argos Information Portal | ||||||
Notes
- 1 2 Compared to the People's Alliance+People's Democratic Party results in the 1987 election.
