South El Monte, California
| South El Monte, California | |
|---|---|
| City | |
| City of South El Monte | |
| Motto: "Growing Our Future" | |
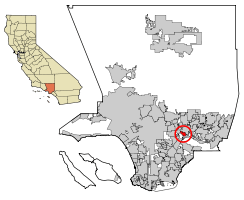
 Location of South El Monte in Los Angeles County, California | |
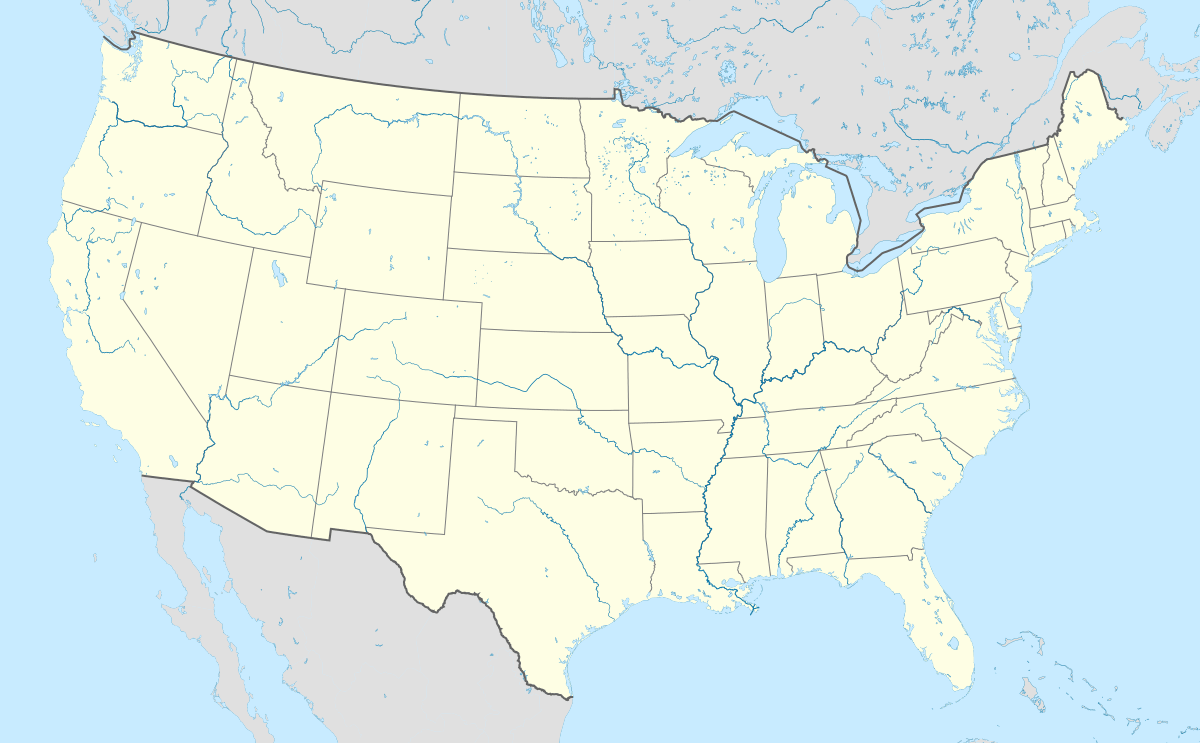
 South El Monte, California Location in the United States | |
| Coordinates: 34°2′56″N 118°2′54″W / 34.04889°N 118.04833°WCoordinates: 34°2′56″N 118°2′54″W / 34.04889°N 118.04833°W | |
| Country |
|
| State |
|
| County |
|
| Incorporated | July 30, 1958[1] |
| Government | |
| • Mayor | Luis Aguinaga[2] |
| • Mayor pro tem | Joseph J. Gonzales[2] |
| • Councilmember | Hector Delgado[2] |
| • Councilmember | Angelica R. Garcia[2] |
| • Councilmember | Willhans Ili[2] |
| Area[3] | |
| • Total | 2.848 sq mi (7.378 km2) |
| • Land | 2.843 sq mi (7.364 km2) |
| • Water | 0.005 sq mi (0.014 km2) 0.19% |
| Elevation[4] | 249 ft (76 m) |
| Population (April 1, 2010) | |
| • Total | 20,116 |
| • Density | 7,100/sq mi (2,700/km2) |
| Time zone | Pacific (UTC-8) |
| • Summer (DST) | PDT (UTC-7) |
| ZIP code | 91733[5] |
| Area code | 626[6] |
| FIPS code | 06-72996 |
| GNIS feature ID | 1656635 |
| Website |
www |
South El Monte is a city in the San Gabriel Valley, in Los Angeles County, California, United States. As of the 2010 census, the city had a population of 20,116, down from 21,144 at the 2000 census.
Geography
According to the United States Census Bureau, the city has a total area of 2.8 square miles (7.4 km²), virtually all land.
Demographics
| Historical population | |||
|---|---|---|---|
| Census | Pop. | %± | |
| 1960 | 4,850 | — | |
| 1970 | 13,443 | 177.2% | |
| 1980 | 16,623 | 23.7% | |
| 1990 | 20,850 | 25.4% | |
| 2000 | 21,144 | 1.4% | |
| 2010 | 20,116 | −4.9% | |
| Est. 2015 | 20,878 | [7] | 3.8% |
2010
The 2010 United States Census[9] reported that South El Monte had a population of 20,116. The population density was 7,061.5 people per square mile (2,726.4/km²). The racial makeup of South El Monte was 10,136 (50.4%) White (3.4% Non-Hispanic White), 107 (0.5%) African American, 250 (1.2%) Native American, 2,211 (11.0%) Asian, 12 (0.1%) Pacific Islander, 6,718 (33.4%) from other races, and 682 (3.4%) from two or more races. Hispanic or Latino of any race were 17,079 persons (84.9%).[10]
The Census reported that 20,059 people (99.7% of the population) lived in households, 47 (0.2%) lived in non-institutionalized group quarters, and 10 (0%) were institutionalized.
There were 4,569 households, out of which 2,643 (57.8%) had children under the age of 18 living in them, 2,554 (55.9%) were opposite-sex married couples living together, 925 (20.2%) had a female householder with no husband present, 524 (11.5%) had a male householder with no wife present. There were 329 (7.2%) unmarried opposite-sex partnerships, and 21 (0.5%) same-sex married couples or partnerships. 397 households (8.7%) were made up of individuals and 208 (4.6%) had someone living alone who was 65 years of age or older. The average household size was 4.39. There were 4,003 families (87.6% of all households); the average family size was 4.45.
The population was spread out with 6,041 people (30.0%) under the age of 18, 2,323 people (11.5%) aged 18 to 24, 5,894 people (29.3%) aged 25 to 44, 4,062 people (20.2%) aged 45 to 64, and 1,796 people (8.9%) who were 65 years of age or older. The median age was 30.4 years. For every 100 females there were 101.9 males. For every 100 females age 18 and over, there were 101.2 males.
There were 4,711 housing units at an average density of 1,653.7 per square mile (638.5/km²), of which 2,208 (48.3%) were owner-occupied, and 2,361 (51.7%) were occupied by renters. The homeowner vacancy rate was 0.7%; the rental vacancy rate was 3.5%. 9,304 people (46.3% of the population) lived in owner-occupied housing units and 10,755 people (53.5%) lived in rental housing units.
According to the 2010 United States Census, South El Monte had a median household income of $44,104, with 19.4% of the population living below the federal poverty line.[10]
2000
As of the census[11] of 2000, there were 21,144 people, 4,620 households, and 4,088 families residing in the city. The population density was 7,330.8 inhabitants per square mile (2,834.6/km²). There were 4,724 housing units at an average density of 1,637.8 per square mile (633.3/km²). The racial makeup of the city was 40.61% White, 0.38% African American, 1.57% Native American, 8.43% Asian, 0.18% Pacific Islander, 43.98% from other races, and 4.84% from two or more races. Hispanic or Latino of any race were 86.03% of the population.
There were 4,620 households out of which 52.0% had children under the age of 18 living with them, 61.0% were married couples living together, 17.5% had a female householder with no husband present, and 11.5% were non-families. 8.0% of all households were made up of individuals and 3.9% had someone living alone who was 65 years of age or older. The average household size was 4.57 and the average family size was 4.61.
In the city the population was spread out with 33.5% under the age of 18, 13.0% from 18 to 24, 31.2% from 25 to 44, 15.0% from 45 to 64, and 7.2% who were 65 years of age or older. The median age was 27 years. For every 100 females there were 105.5 males. For every 100 females age 18 and over, there were 104.0 males.
The median income for a household in the city was $24,656, and the median income for a family was $34,349. Males had a median income of $21,075 versus $18,949 for females. The per capita income for the city was $10,130. About 16.2% of families and 19.0% of the population were below the poverty line, including 22.7% of those under age 18 and 11.0% of those age 65 or over.
Education
Elementary school districts include:
- El Monte City School District
- Loma Elementary School
- Potrero Elementary School
- Mountain View School District
- Miramonte Elementary School
- Monte Vista Elementary School
- Valle Lindo School District
- New Temple Elementary School
- Dean L. Shively Elementary School
The El Monte Union High School District operates South El Monte High School.
Private Schools:
- Epiphany Catholic School
Asahi Gakuen, a part-time Japanese school, operates its San Gabriel campus (サンゲーブル校 Sangēburu-kō) at South El Monte High School.[12]
Government
The City of South El Monte has four Council members elected at large for a term of four years. The Mayor is elected at large for a term of four years.
The South El Monte City Council consists of:[2]
- Mayor Pro Tem Gloria Olmos
- Councilmember Hector Delgado,
- Councilwoman Angelica R. Garcia, and
- Councilmember Joseph J. Gonzales.
The City of South El Monte has three standing commissions: Community Services Commission, Patriotic Commission, and Planning Commission. Each commission consists of residents appointed by the City Council to serve a term of two years.
Community Services Commission: Commissioners: Yolanda Del Rio (Chair), Josephine Blanco, Lauren Guevara, and Rudy Lopez.
Patriotic Commission: Commissioners: Fernando Apodaca, David Del Rio, Heliodoro Duarte, Jr., Dorris Hennings, Nancy Muniz, and Salvador Ramirez.
Planning Commission: Commissioners: Jaime Alvarez, Joseph M. Armendariz, Robert Armendariz, Danny Caustrita, and Lorenzo Lauria.
State and federal representation
In the state legislature South El Monte is in the 22nd Senate District, represented by Democrat Ed Hernandez, and in the 57th Assembly District, represented by Democrat Ian Calderon.[13]
In the United States House of Representatives, South El Monte is in California's 38th congressional district, represented by Democrat Linda Sánchez.[14]
Public safety
South El Monte is served by Los Angeles County for fire services.
The Los Angeles County Sheriff's Department (LASD) operates the Temple Station in Temple City, serving South El Monte.[15]
Media
South El Monte community news are provided by the San Gabriel Valley Tribune.
References
- ↑ "California Cities by Incorporation Date" (Word). California Association of Local Agency Formation Commissions. Retrieved August 25, 2014.
- 1 2 3 4 5 6 "CITY DEPARTMENTS & SERVICES : City Council". City of South El Monte. Retrieved December 30, 2014.
- ↑ "2010 Census U.S. Gazetteer Files – Places – California". United States Census Bureau.
- ↑ "South El Monte". Geographic Names Information System. United States Geological Survey. Retrieved February 23, 2015.
- ↑ "USPS - ZIP Code Lookup - Find a ZIP+ 4 Code By City Results". Retrieved 2007-01-18.
- ↑ "Number Administration System - NPA and City/Town Search Results". Retrieved 2007-01-18.
- ↑ "Annual Estimates of the Resident Population for Incorporated Places: April 1, 2010 to July 1, 2015". Retrieved July 2, 2016.
- ↑ "Census of Population and Housing". Census.gov. Retrieved June 4, 2015.
- ↑ "2010 Census Interactive Population Search: CA - South El Monte city". U.S. Census Bureau. Retrieved July 12, 2014.
- 1 2 http://quickfacts.census.gov/qfd/states/06/0672996.html. Missing or empty
|title=(help) - ↑ "American FactFinder". United States Census Bureau. Retrieved 2008-01-31.
- ↑ "サンゲーブル校." Asahi Gakuen. Retrieved on March 30, 2014. "所在地: SOUTH EL MONTE HIGH ASHOOL 1001 N. Durfee Ave., South El Monte, CA 91733 "
- ↑ "Statewide Database". UC Regents. Retrieved December 30, 2014.
- ↑ "California's 38th Congressional District - Representatives & District Map". Civic Impulse, LLC.
- ↑ "Temple Station." Los Angeles County Sheriff's Department. Retrieved on January 21, 2010.
External links
 |
Rosemead | El Monte | El Monte |  |
| Rosemead South San Gabriel |
|
Unincorporated Los Angeles County | ||
| ||||
| | ||||
| Whittier Narrows | Whittier Narrows | Unincorporated Los Angeles County |
