Southampton City Council election, 2016
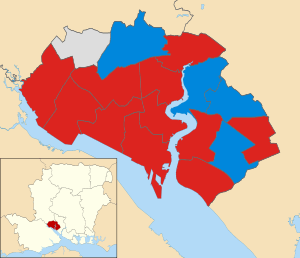
Map of the results of the 2016 Southampton council election. Labour in red, Conservatives in blue, and Independents in grey.
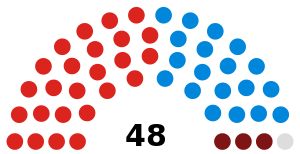
Composition of the whole Southampton City Council after the 2015 elections. Labour in red, Conservatives in blue, Councillors Against Cuts in dark red, and Independent in grey.
The 2016 Southampton City Council election took place on 5 May 2016 to elect members of Southampton City Council in England. This was on the same day as other local elections.
After the election, the composition of the council was
- Labour 25
- Conservative 19 (-1)
- Councillors Against Cuts 3 (+1)
- Independent 1
Election result
Southampton Council is elected in thirds, which means all comparisons are to the corresponding Southampton Council election, 2012.
| Southampton Local Election Result 2016 | ||||||||||
|---|---|---|---|---|---|---|---|---|---|---|
| Party | Seats | Gains | Losses | Net gain/loss | Seats % | Votes % | Votes | +/− | ||
| Labour | 12 | 2 | 2 | 0 | 66.7 | 41.7 | 23,456 | -2.3 | ||
| Conservative | 5 | 1 | 2 | -1 | 27.8 | 31.3 | 17,605 | -4.9 | ||
| Independent | 1 | 1 | 0 | 1 | 5.6 | 4.1 | 2,286 | +2.7 | ||
| UKIP | 0 | 0 | 0 | 0 | 0.0 | 7.9 | 4,444 | +5.5 | ||
| Liberal Democrat | 0 | 0 | 0 | 0 | 0.0 | 7.0 | 3,911 | -2.9 | ||
| Green | 0 | 0 | 0 | 0 | 0.0 | 6.1 | 3,451 | +2.2 | ||
| TUSC | 0 | 0 | 0 | 0 | 0.0 | 1.9 | 1,060 | -0.3 | ||
| Comparison to Local Election Result 2015 | ||||||||||
|---|---|---|---|---|---|---|---|---|---|---|
| Party | Votes % | +/- | ||||||||
| Labour | 41.7 | | ||||||||
| Conservative | 31.3 | | ||||||||
| Independent | 4.1 | | ||||||||
| UKIP | 7.9 | | ||||||||
| Liberal Democrat | 7.0 | | ||||||||
| Green | 6.1 | | ||||||||
| TUSC | 1.9 | | ||||||||
Ward results
| Party | Candidate | Votes | % | ± | |
|---|---|---|---|---|---|
| Labour | Darren Paffey | 1,285 | 46.5 | ||
| Conservative | Spencer Bowman | 867 | 31.4 | ||
| Independent | John Easton | 243 | 8.8 | ||
| Green | Joe Cox | 221 | 8.0 | ||
| Liberal Democrat | Tom Gravatt | 137 | 5.0 | ||
| Majority | 418 | 15.1 | |||
| Turnout | 2,765 | 24.8 | |||
| Labour hold | Swing | ||||
| Party | Candidate | Votes | % | ± | |
|---|---|---|---|---|---|
| Conservative | John Hannides | 1,452 | 47.4 | ||
| Labour | Matthew Renyard | 710 | 23.2 | ||
| Liberal Democrat | Steven Hulbert | 356 | 11.6 | ||
| UKIP | Jean Romsey | 291 | 9.5 | ||
| Green | James Peploe | 204 | 6.7 | ||
| TUSC | David Rawlinson | 28 | 0.9 | ||
| Majority | 742 | 24.2 | |||
| Turnout | 3,063 | 31.2 | |||
| Conservative hold | Swing | ||||
| Party | Candidate | Votes | % | ± | |
|---|---|---|---|---|---|
| Labour | Stephen Barnes-Andrews | 1,866 | 69.2 | ||
| Conservative | Felix Davies | 319 | 11.8 | ||
| Green | Rosie Pearce | 206 | 7.6 | ||
| UKIP | Richard Lyons | 151 | 5.6 | ||
| Liberal Democrat | Paul Clarke | 110 | 4.1 | ||
| TUSC | Andrew Howe | 30 | 1.1 | ||
| Majority | 1,547 | 57.3 | |||
| Turnout | 6,122 | 54.91 | |||
| Labour hold | Swing | ||||
| Party | Candidate | Votes | % | ± | |
|---|---|---|---|---|---|
| Labour | Frances Murphy | 1,150 | 41.2 | ||
| Conservative | Edward Osmond | 783 | 28.1 | ||
| UKIP | Kim Rose | 541 | 19.4 | ||
| Liberal Democrat | Rob Naish | 132 | 4.7 | ||
| Green | Jodie Coperland | 128 | 4.6 | ||
| TUSC | Dawn Strutt | 42 | 1.5 | ||
| Majority | 367 | 13.1 | |||
| Turnout | 2,791 | 28.1 | |||
| Labour hold | Swing | ||||
| Party | Candidate | Votes | % | ± | |
|---|---|---|---|---|---|
| Conservative | Ivan White | 1,398 | 42.0 | ||
| Labour | Stephen Fenerty | 1,223 | 36.7 | ||
| Green | Jennifer Barnes | 342 | 10.3 | ||
| Liberal Democrat | James Read | 261 | 7.8 | ||
| TUSC | Linda Boulton | 80 | 2.4 | ||
| Majority | 175 | 5.3 | |||
| Turnout | 3,330 | 32.1 | |||
| Conservative hold | Swing | ||||
| Party | Candidate | Votes | % | ± | |
|---|---|---|---|---|---|
| Independent | Tammy Thomas | 1,317 | 38.6 | ||
| Labour | Sally Spicer | 924 | 27.1 | ||
| UKIP | Joe Lockyer | 498 | 14.6 | ||
| Conservative | Trevor Glasspool | 396 | 11.6 | ||
| Liberal Democrat | Victoria Galton | 113 | 3.3 | ||
| Independent | Richard McQuillan | 84 | 2.5 | ||
| Green | Derek Chandler | 70 | 2.1 | ||
| Majority | 393 | 11.5 | |||
| Turnout | 3,414 | 33.2 | |||
| Independent gain from Labour | Swing | ||||
| Party | Candidate | Votes | % | ± | |
|---|---|---|---|---|---|
| Labour | Dave Shields | 1,623 | 47.3 | ||
| Conservative | Chris Grace | 1,063 | 31.0 | ||
| UKIP | Colin Hingston | 306 | 8.9 | ||
| Green | Jonathan Martin | 256 | 7.5 | ||
| Liberal Democrat | Amy Greenwood | 178 | 5.2 | ||
| Majority | 560 | 16.3 | |||
| Turnout | 3,433 | 33.1 | |||
| Labour hold | Swing | ||||
| Party | Candidate | Votes | % | ± | |
|---|---|---|---|---|---|
| Conservative | Peter Baillie | 1,525 | |||
| Conservative | Valerie Laurent | 1,362 | |||
| Labour | Mary Lloyd | 1,054 | |||
| Labour | Daniel Lucas | 883 | |||
| Green | Chris Bluemel | 246 | |||
| Liberal Democrat | Carol Lloyd | 204 | |||
| Liberal Democrat | John Dennis | 189 | |||
| TUSC | Carole Fletcher | 171 | |||
| Green | Michael Mawle | 165 | |||
| TUSC | Graham O'Reilly | 133 | |||
| Turnout | 3,280 | 32.1 | |||
| Conservative hold | Swing | ||||
| Conservative hold | Swing | ||||
| Party | Candidate | Votes | % | ± | |
|---|---|---|---|---|---|
| Labour | Sarah Taggart | 1,517 | 41.4 | ||
| Conservative | Steven Galton | 1,332 | 36.4 | ||
| UKIP | Pearline Hingston | 442 | 12.1 | ||
| Liberal Democrat | Graham Galton | 167 | 4.6 | ||
| Green | Jonathan Bean | 152 | 4.2 | ||
| TUSC | Peter Wyatt | 31 | 0.8 | ||
| Majority | 185 | 5.1 | |||
| Turnout | 3,660 | 34.0 | |||
| Labour gain from Conservative | Swing | ||||
| Party | Candidate | Votes | % | ± | |
|---|---|---|---|---|---|
| Labour | Eamonn Keogh | 1,655 | 45.0 | ||
| Conservative | Marley Guthrie | 1,178 | 32.0 | ||
| UKIP | Vincent Avellino | 468 | 12.7 | ||
| Liberal Democrat | Eileen Bowers | 180 | 4.9 | ||
| Green | Gemma Mathieson | 160 | 4.4 | ||
| TUSC | Mike Marx | 21 | 0.6 | ||
| Majority | 477 | 13.0 | |||
| Turnout | 3,677 | 35.8 | |||
| Labour hold | Swing | ||||
| Party | Candidate | Votes | % | ± | |
|---|---|---|---|---|---|
| Labour | John Savage | 1,106 | 33.3 | ||
| Conservative | Linda Norris | 851 | 25.6 | ||
| Liberal Democrat | Adrian Ford | 823 | 24.8 | ||
| Green | Kieren Brown | 313 | 9.4 | ||
| UKIP | Molly Chandler | 180 | 5.4 | ||
| TUSC | Nick Chaffey | 34 | 1.0 | ||
| Majority | 255 | 7.7 | |||
| Turnout | 3,318 | 32.5 | |||
| Labour gain from Conservative | Swing | ||||
| Party | Candidate | Votes | % | ± | |
|---|---|---|---|---|---|
| Labour | Lee Whitbread | 1,412 | 46.4 | ||
| UKIP | Stephen McKinnon | 590 | 19.4 | ||
| Conservative | Preshan Jeevaratnam | 437 | 14.4 | ||
| Independent | Denise Wyatt | 413 | 13.6 | ||
| Liberal Democrat | Simon Stokes | 101 | 3.3 | ||
| Green | Chris James | 76 | 2.5 | ||
| Majority | 822 | 27.0 | |||
| Turnout | 3,044 | 29.0 | |||
| Labour hold | Swing | ||||
| Party | Candidate | Votes | % | ± | |
|---|---|---|---|---|---|
| Labour | Mark Chaloner | 1,931 | 46.2 | ||
| Conservative | Matthew Turpin | 1,142 | 27.3 | ||
| UKIP | Nick Ray | 421 | 10.1 | ||
| Liberal Democrat | Peter Galton | 253 | 6.0 | ||
| Independent | David Fletcher | 229 | 5.5 | ||
| Green | John Spottiswoode | 198 | 4.7 | ||
| Majority | 789 | 18.9 | |||
| Turnout | 4,182 | 41.2 | |||
| Labour hold | Swing | ||||
| Party | Candidate | Votes | % | ± | |
|---|---|---|---|---|---|
| Conservative | James Baillie | 1,445 | 40.3 | ||
| Labour | Dan Jeffery | 1,286 | 35.9 | ||
| UKIP | Derek Humber | 556 | 15.5 | ||
| Green | Nick Ford | 120 | 3.3 | ||
| Liberal Democrat | Ken Darke | 110 | 3.1 | ||
| TUSC | Declan Clune | 50 | 1.4 | ||
| Majority | 159 | 4.4 | |||
| Turnout | 3,584 | 34.0 | |||
| Conservative gain from Labour | Swing | ||||
| Party | Candidate | Votes | % | ± | |
|---|---|---|---|---|---|
| Labour | Sharon Mintoff | 1,145 | 47.6 | ||
| Conservative | Harmeet Singh Brar | 693 | 28.8 | ||
| Green | Angela Cotton | 241 | 10.0 | ||
| Liberal Democrat | Jules Poulain | 205 | 8.5 | ||
| TUSC | Kevin Kayes | 102 | 4.2 | ||
| Majority | 452 | 18.8 | |||
| Turnout | 2,405 | 28.7 | |||
| Labour hold | Swing | ||||
| Party | Candidate | Votes | % | ± | |
|---|---|---|---|---|---|
| Labour | Sue Blatchford | 1,407 | |||
| Labour | Chris Hammond | 1,279 | |||
| Conservative | Alex Fiuza | 695 | |||
| Conservative | Joe Spencer | 667 | |||
| Liberal Democrat | Colin Bleach | 269 | |||
| TUSC | Sue Atkins | 213 | |||
| Green | Katherine Barbour | 213 | |||
| Green | Ronald Meldrum | 140 | |||
| TUSC | Graham Henry | 125 | |||
| Liberal Democrat | Keith Reed | 123 | |||
| Turnout | 2,834 | 28.3 | |||
| Labour hold | Swing | ||||
| Labour hold | Swing | ||||
References
| Preceded by Southampton City Council election, 2015 |
Southampton City Council elections | Succeeded by Southampton City Council election, 2018 |
This article is issued from Wikipedia - version of the 5/10/2016. The text is available under the Creative Commons Attribution/Share Alike but additional terms may apply for the media files.