Wigan Metropolitan Borough Council election, 2006
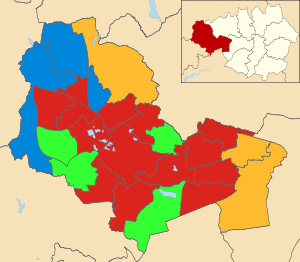
Map of the results of the 2006 Wigan council election. Labour in red, Conservatives in blue, Community Action Party in green and Liberal Democrats in yellow.
Elections to Wigan Council were held on 4 May 2006. One-third of the council was up for election and the Labour party kept overall control of the council.[1] Overall turnout was 29.2%.[2][3][4]
Election result
| Wigan Local Election Result 2006 | ||||||||||
|---|---|---|---|---|---|---|---|---|---|---|
| Party | Seats | Gains | Losses | Net gain/loss | Seats % | Votes % | Votes | +/− | ||
| Labour | 14 | 3 | 2 | +1 | 56.0 | 42.8 | 29,588 | +0.8% | ||
| Conservative | 4 | 2 | 0 | +2 | 16.0 | 21.7 | 15,014 | +4.2% | ||
| Community Action | 4 | 0 | 3 | -3 | 16.0 | 16.8 | 11,622 | -7.9% | ||
| Liberal Democrat | 3 | 0 | 0 | 0 | 12.0 | 11.8 | 8,142 | +1.3% | ||
| BNP | 0 | 0 | 0 | 0 | 0 | 2.8 | 1,948 | +0.6% | ||
| UKIP | 0 | 0 | 0 | 0 | 0 | 1.6 | 1,105 | +1.6% | ||
| Independent | 0 | 0 | 0 | 0 | 0 | 1.2 | 828 | -0.5% | ||
| Green | 0 | 0 | 0 | 0 | 0 | 0.9 | 610 | -0.5% | ||
| Legalise Cannabis | 0 | 0 | 0 | 0 | 0 | 0.1 | 91 | +0.1% | ||
This result had the following consequences for the total number of seats on the Council after the elections:
| Party | Previous council | New council | |||
|---|---|---|---|---|---|
| Labour | 42 | 43 | |||
| Community Action | 18 | 15 | |||
| Conservative | 7 | 9 | |||
| Liberal Democrat | 8 | 8 | |||
| BNP | 0 | 0 | |||
| UKIP | 0 | 0 | |||
| Independent | 0 | 0 | |||
| Green | 0 | 0 | |||
| Legalise Cannabis | 0 | 0 | |||
| Total | 75 | 75 | |||
| Working majority | 9 | 11 | |||
Ward results
| Party | Candidate | Votes | % | ± | |
|---|---|---|---|---|---|
| Labour | Carl Sweeney | 1,327 | 52.1 | -6.0 | |
| Community Action | John Shale | 541 | 21.3 | +21.3 | |
| BNP | Dennis Shambley | 421 | 16.5 | -4.2 | |
| Conservative | Marion Green | 243 | 9.5 | -10.5 | |
| Rejected ballots | 13 | 0.5 | -0.5 | ||
| Majority | 786 | 30.9 | -6.4 | ||
| Turnout | 2,545 | 25.0 | -6.6 | ||
| Labour hold | Swing | -13.6 | |||
| Party | Candidate | Votes | % | ± | |
|---|---|---|---|---|---|
| Labour | Nigel Ash | 1,261 | 45.3 | +13.5 | |
| Community Action | Claire Daington | 1,200 | 43.1 | -14.7 | |
| Conservative | Marie Winstanley | 320 | 11.5 | +1.7 | |
| Rejected ballots | 0 | 0.0 | -0.5 | ||
| Majority | 61 | 2.2 | -23.8 | ||
| Turnout | 2,781 | 30.4 | -14.2 | ||
| Labour gain from Community Action | Swing | +14.1 | |||
| Party | Candidate | Votes | % | ± | |
|---|---|---|---|---|---|
| Liberal Democrat | Jean Beswick | 1,403 | 43.8 | -1.5 | |
| Labour | Michael McLoughlin | 1,291 | 40.3 | -11.8 | |
| Conservative | Deborah Fairhurst | 506 | 15.8 | +15.8 | |
| Rejected ballots | 0 | 0.0 | -2.5 | ||
| Majority | 112 | 3.5 | -3.3 | ||
| Turnout | 3,200 | 31.9 | -2.7 | ||
| Liberal Democrat hold | Swing | +5.1 | |||
| Party | Candidate | Votes | % | ± | |
|---|---|---|---|---|---|
| Liberal Democrat | Joseph Haley | 1,472 | 48.9 | +12.7 | |
| Labour | Alan Stephenson | 865 | 28.7 | -11.0 | |
| Conservative | Sean Ell | 674 | 22.4 | +22.4 | |
| Rejected ballots | 0 | 0.0 | -1.0 | ||
| Majority | 607 | 20.2 | +16.7 | ||
| Turnout | 3,011 | 31.1 | -8.6 | ||
| Liberal Democrat hold | Swing | +11.8 | |||
| Party | Candidate | Votes | % | ± | |
|---|---|---|---|---|---|
| Labour | Anne Turnock | 906 | 46.0 | -2.4 | |
| Liberal Democrat | Peter Bowdler | 676 | 34.3 | +34.3 | |
| Conservative | Malcolm Parr | 387 | 19.7 | -3.5 | |
| Rejected ballots | 0 | 0.0 | -1.3 | ||
| Majority | 230 | 11.7 | -9.6 | ||
| Turnout | 1,969 | 25.8 | -7.9 | ||
| Labour hold | Swing | -18.3 | |||
| Party | Candidate | Votes | % | ± | |
|---|---|---|---|---|---|
| Labour | Karen Aldred | 1,507 | 49.7 | +12.3 | |
| Liberal Democrat | Susan Wilson | 960 | 31.7 | -11.3 | |
| Conservative | Rosina Oxley | 331 | 10.9 | -0.4 | |
| Green | Nicholas Redmond | 232 | 7.7 | -0.1 | |
| Rejected ballots | 0 | 0.0 | -0.5 | ||
| Majority | 547 | 18.1 | +12.6 | ||
| Turnout | 3,030 | 27.6 | -8.7 | ||
| Labour hold | Swing | +11.8 | |||
| Party | Candidate | Votes | % | ± | |
|---|---|---|---|---|---|
| Community Action | Brian Merry | 1,429 | 45.2 | -15.0 | |
| Labour | George Harrison | 1,050 | 33.2 | +1.9 | |
| BNP | Kenneth Haslam | 457 | 14.5 | +14.5 | |
| Conservative | William Winstanley | 171 | 5.4 | -2.8 | |
| New Party | Duane Phillips | 45 | 1.4 | +1.4 | |
| Rejected ballots | 7 | 0.2 | -0.1 | ||
| Majority | 379 | 12.0 | -16.9 | ||
| Turnout | 3,159 | 33.7 | -8.6 | ||
| Community Action hold | Swing | -8.4 | |||
| Party | Candidate | Votes | % | ± | |
|---|---|---|---|---|---|
| Labour | Shirley Dewhurst | 1,369 | 59.1 | +7.8 | |
| Community Action | Edna Hulme | 933 | 40.3 | -6.3 | |
| Rejected ballots | 15 | 0.6 | -1.5 | ||
| Majority | 436 | 18.8 | +14.1 | ||
| Turnout | 2,317 | 24.7 | -5.4 | ||
| Labour hold | Swing | +7.0 | |||
| Party | Candidate | Votes | % | ± | |
|---|---|---|---|---|---|
| Labour | Gerard Bretherton | 1,410 | 52.0 | +12.9 | |
| Community Action | Peter Solinas | 953 | 35.2 | -14.3 | |
| Conservative | Jeanette Leigh | 347 | 12.8 | +2.1 | |
| Rejected ballots | 0 | 0.0 | -0.7 | ||
| Majority | 457 | 16.9 | +6.6 | ||
| Turnout | 2,710 | 30.7 | -7.6 | ||
| Labour gain from Community Action | Swing | +13.6 | |||
| Party | Candidate | Votes | % | ± | |
|---|---|---|---|---|---|
| Labour | James Talbot | 1,217 | 48.4 | +9.2 | |
| Community Action | Debbie Grace | 913 | 36.3 | +7.7 | |
| Conservative | Joan Pietre | 387 | 15.4 | +5.4 | |
| Rejected ballots | 0 | 0.0 | -0.6 | ||
| Majority | 304 | 12.1 | +1.6 | ||
| Turnout | 2,517 | 25.6 | -19.5 | ||
| Labour gain from Community Action | Swing | +0.7 | |||
| Party | Candidate | Votes | % | ± | |
|---|---|---|---|---|---|
| Community Action | Barry Fagan | 1,100 | 47.4 | +12.6 | |
| Labour | John Holland | 832 | 35.9 | +0.8 | |
| Conservative | Denise Young | 388 | 16.7 | +3.3 | |
| Rejected ballots | 0 | 0.0 | -0.7 | ||
| Majority | 268 | 11.6 | +11.4 | ||
| Turnout | 2,320 | 25.9 | -16.2 | ||
| Community Action hold | Swing | +5.9 | |||
| Party | Candidate | Votes | % | ± | |
|---|---|---|---|---|---|
| Labour | James Moodie | 1,279 | 60.7 | -5.8 | |
| Community Action | Syd Hall | 639 | 30.3 | -0.5 | |
| Conservative | Alicia Eccles | 173 | 8.2 | +8.2 | |
| Rejected ballots | 15 | 0.7 | -1.9 | ||
| Majority | 640 | 30.4 | -5.2 | ||
| Turnout | 2,106 | 24.6 | -1.8 | ||
| Labour hold | Swing | -2.6 | |||
| Party | Candidate | Votes | % | ± | |
|---|---|---|---|---|---|
| Labour | Fred Walker | 1,120 | 46.1 | -0.5 | |
| Liberal Democrat | Gordon Jackson | 912 | 37.5 | +37.5 | |
| Conservative | Dorothy Angell | 399 | 16.4 | -4.9 | |
| Rejected ballots | 0 | 0.0 | -1.0 | ||
| Majority | 208 | 8.6 | -6.7 | ||
| Turnout | 2,431 | 26.8 | -7.3 | ||
| Labour hold | Swing | -19.0 | |||
| Party | Candidate | Votes | % | ± | |
|---|---|---|---|---|---|
| Labour | Charles Rigby | 1,273 | 39.8 | -0.8 | |
| Conservative | Andrew Oxley | 763 | 23.9 | -3.2 | |
| Community Action | Stephen Ellison | 621 | 19.4 | -11.4 | |
| BNP | Richard Close | 448 | 14.0 | +14.0 | |
| Legalise Cannabis | Thomas Hampson | 91 | 2.8 | +2.8 | |
| Rejected ballots | 0 | 0.0 | -1.4 | ||
| Majority | 510 | 16.0 | +6.2 | ||
| Turnout | 3,196 | 30.7 | -6.6 | ||
| Labour hold | Swing | +1.2 | |||
| Party | Candidate | Votes | % | ± | |
|---|---|---|---|---|---|
| Labour | Peter Smith | 1,377 | 54.9 | -3.2 | |
| Liberal Democrat | Kevin Jones | 721 | 28.7 | +28.7 | |
| Conservative | Alan Lowe | 410 | 16.3 | +16.3 | |
| Rejected ballots | 0 | 0.0 | -1.7 | ||
| Majority | 656 | 26.2 | -9.1 | ||
| Turnout | 2,508 | 23.4 | -4.3 | ||
| Labour hold | Swing | -15.9 | |||
| Party | Candidate | Votes | % | ± | |
|---|---|---|---|---|---|
| Community Action | Edward Houlton | 1,075 | 34.1 | -10.4 | |
| Conservative | James Grundy | 1,041 | 33.0 | +11.2 | |
| Labour | Trevor Ward | 1,034 | 32.8 | +0.8 | |
| Rejected ballots | 0 | 0.0 | -1.6 | ||
| Majority | 34 | 1.1 | -11.4 | ||
| Turnout | 3,150 | 32.2 | -8.7 | ||
| Community Action hold | Swing | -10.8 | |||
| Party | Candidate | Votes | % | ± | |
|---|---|---|---|---|---|
| Conservative | Peter Thompson | 1,308 | 38.4 | -1.0 | |
| Labour | Michael Barnes | 1,266 | 37.2 | +5.6 | |
| BNP | Charles Mather | 622 | 18.3 | +3.1 | |
| UKIP | Stephen Hawkins | 208 | 6.1 | +6.1 | |
| Rejected ballots | 0 | 0.0 | -0.4 | ||
| Majority | 42 | 1.2 | -6.6 | ||
| Turnout | 3,404 | 37.1 | -12.4 | ||
| Conservative gain from Labour | Swing | -3.3 | |||
| Party | Candidate | Votes | % | ± | |
|---|---|---|---|---|---|
| Labour | Paul Prescott | 1,452 | 64.8 | +18.0 | |
| Community Action | Robert Beale | 320 | 14.3 | -23.3 | |
| Liberal Democrat | Darren Atherton | 281 | 12.5 | +12.5 | |
| UKIP | Aspey David | 189 | 8.4 | +8.4 | |
| Rejected ballots | 0 | 0.0 | -1.3 | ||
| Majority | 1,132 | 50.5 | +41.3 | ||
| Turnout | 2,242 | 22.7 | -8.4 | ||
| Labour hold | Swing | +20.6 | |||
| Party | Candidate | Votes | % | ± | |
|---|---|---|---|---|---|
| Conservative | Angela Bland | 1,827 | 57.4 | +21.6 | |
| Labour | Michael Crosby | 1,311 | 41.2 | -4.1 | |
| Rejected ballots | 46 | 1.4 | +0.7 | ||
| Majority | 516 | 16.2 | +6.7 | ||
| Turnout | 3,184 | 33.8 | -10.2 | ||
| Conservative gain from Labour | Swing | +12.8 | |||
| Party | Candidate | Votes | % | ± | |
|---|---|---|---|---|---|
| Conservative | Neil Whittingham | 1,866 | 54.8 | +21.6 | |
| Labour | Diana Davies | 1,029 | 30.2 | -4.4 | |
| UKIP | Gregory Atherton | 493 | 14.5 | +14.5 | |
| Rejected ballots | 17 | 0.5 | -0.2 | ||
| Majority | 837 | 24.6 | +23.1 | ||
| Turnout | 3,405 | 36.0 | -6.5 | ||
| Conservative hold | Swing | +13.0 | |||
| Party | Candidate | Votes | % | ± | |
|---|---|---|---|---|---|
| Liberal Democrat | Richard Derricutt | 1,717 | 58.7 | +4.0 | |
| Labour | Pamela Stewart | 565 | 19.3 | -14.1 | |
| Green | Craig Cohen | 378 | 12.9 | +12.9 | |
| Conservative | Hilary Hayden | 266 | 9.1 | -2.2 | |
| Rejected ballots | 0 | 0.0 | -0.6 | ||
| Majority | 1,152 | 39.4 | +18.1 | ||
| Turnout | 2,926 | 28.9 | -11.2 | ||
| Liberal Democrat hold | Swing | +9.0 | |||
| Party | Candidate | Votes | % | ± | |
|---|---|---|---|---|---|
| Conservative | Gareth Fairhurst | 1,905 | 60.0 | +5.9 | |
| Labour | Marcia Dooley | 1,270 | 40.0 | -3.0 | |
| Rejected ballots | 0 | 0.0 | -2.9 | ||
| Majority | 635 | 20.0 | +8.9 | ||
| Turnout | 3,175 | 34.6 | -8.6 | ||
| Conservative hold | Swing | +4.4 | |||
| Party | Candidate | Votes | % | ± | |
|---|---|---|---|---|---|
| Labour | Joe Shaw | 1,354 | 49.0 | N/A | |
| Independent | Philip Parkes | 783 | 28.3 | N/A | |
| Conservative | Keith Jones | 613 | 22.2 | N/A | |
| Rejected ballots | 16 | 0.6 | N/A | ||
| Majority | 571 | 20.6 | N/A | ||
| Turnout | 2,766 | 27.0 | N/A | ||
| Labour hold | Swing | N/A | |||
| Party | Candidate | Votes | % | ± | |
|---|---|---|---|---|---|
| Community Action | William Wilkes | 1,160 | 43.5 | -4.9 | |
| Labour | Philip Kelly | 905 | 33.9 | -3.3 | |
| Conservative | Charles Cartwright | 382 | 14.3 | +0.3 | |
| UKIP | Alan Freeman | 215 | 8.1 | +8.1 | |
| Rejected ballots | 7 | 0.3 | -0.2 | ||
| Majority | 255 | 9.6 | -1.5 | ||
| Turnout | 2,669 | 30.1 | -12.5 | ||
| Community Action hold | Swing | -0.8 | |||
| Party | Candidate | Votes | % | ± | |
|---|---|---|---|---|---|
| Labour | Patricia Holland | 1,318 | 55.4 | +6.6 | |
| Community Action | Leanne Brotherton | 738 | 31.0 | -6.0 | |
| Conservative | Thomas Sutton | 307 | 12.9 | -0.5 | |
| Rejected ballots | 15 | 0.6 | -0.1 | ||
| Majority | 580 | 24.4 | +12.5 | ||
| Turnout | 2,378 | 26.0 | -10.0 | ||
| Labour hold | Swing | +6.3 | |||
References
- ↑ "Local elections: Wigan". BBC News Online. Retrieved 2009-12-17.
- 1 2 3 4 5 6 7 8 9 10 11 12 13 14 15 16 17 18 19 20 21 22 23 24 25 26 "Wigan Council results from 1973 to 2008" (PDF). wigan.gov.uk. Retrieved 2012-01-30.
- 1 2 3 4 5 6 7 8 9 10 11 12 13 14 15 16 17 18 19 20 21 22 23 24 25 26 "Local Election Results 04 May 2006". wiganmbc.gov.uk. Retrieved 2012-06-28.
- 1 2 3 4 5 6 7 8 9 10 11 12 13 14 15 16 17 18 19 20 21 22 23 24 25 26 "Local Elections Archive Project: 2006 - Wigan". andrewteale.me.uk. Retrieved 2012-06-28.
| Mayor | |
|---|---|
| Bolton | |
| Bury | |
| Manchester | |
| Oldham | |
| Rochdale | |
| Salford | |
| Stockport | |
| Tameside | |
| Trafford | |
| Wigan | |
| County Council |
|
| |
This article is issued from Wikipedia - version of the 10/19/2016. The text is available under the Creative Commons Attribution/Share Alike but additional terms may apply for the media files.