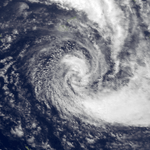
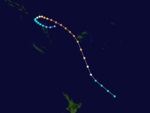
1984–85 South Pacific cyclone season
| |
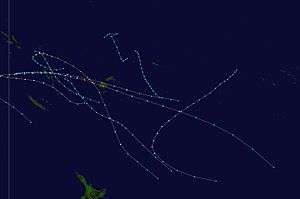
| Season summary map |
| First system formed |
December 26, 1984 |
| Last system dissipated |
March 20, 1985 |
| Strongest storm1 |
Hina – 910 hPa (mbar), 220 km/h (140 mph) (10-minute sustained) |
| Total depressions |
9 |
| Tropical cyclones |
9 |
| Severe tropical cyclones |
5 |
| Total fatalities |
Unknown |
| Total damage |
Unknown |
| 1Strongest storm is determined by lowest pressure |
South Pacific tropical cyclone seasons
1982–83, 1983–84, 1984-85, 1985–86, 1986–87 |
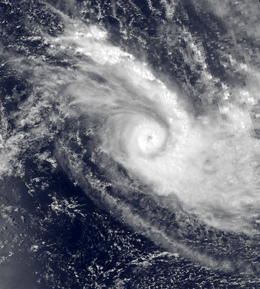
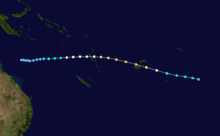
The 1984–85 South Pacific cyclone season was a near normal tropical cyclone season, with nine tropical cyclones occurring within the basin between 160°E and 120°W. The season ran from November 1, 1984 to April 30, 1985, with tropical cyclones officially monitored by the Fiji Meteorological Service (FMS), Australian Bureau of Meteorology (BoM) and New Zealand's MetService. The United States Joint Typhoon Warning Center (JTWC) and other national meteorological services including Météo-France and NOAA also monitored the basin during the season. During the season there was nine tropical cyclones occurring within the basin, including three that moved into the basin from the Australian region. The BoM, MetService and RSMC Nadi all estimated sustained wind speeds over a period of 10-minutes, which are subsequently compared to the Australian tropical cyclone intensity scale, while the JTWC estimated sustained winds over a 1-minute period, which are subsequently compared to the Saffir–Simpson hurricane wind scale (SSHWS).
Seasonal summary
During November and December no significant tropical cyclones developed in or moved into the basin in the region,
Storms
Unnamed Tropical Cyclone
| Category 1 tropical cyclone (Australian scale) |
| Tropical storm (SSHWS) |
|
|
| Duration |
December 26 – December 28 |
| Peak intensity |
85 km/h (50 mph) (10-min) 987 hPa (mbar) |
An unnamed tropical cyclone existed from December 26 to December 28.
Tropical Cyclone Monica
| Category 2 tropical cyclone (Australian scale) |
| Tropical storm (SSHWS) |
|
|
| Duration |
December 28 – January 3 |
| Peak intensity |
110 km/h (70 mph) (10-min) 975 hPa (mbar) |
Tropical Cyclone Monica existed from December 29 to December 30.
Tropical Cyclone Drena
| Category 1 tropical cyclone (Australian scale) |
| Tropical storm (SSHWS) |
|
|
| Duration |
January 9 – January 16 |
| Peak intensity |
85 km/h (50 mph) (10-min) 987 hPa (mbar) |
Tropical Cyclone Drena existed from January 9 to January 16.
Severe Tropical Cyclone Eric
| Category 3 severe tropical cyclone (Australian scale) |
| Category 3 tropical cyclone (SSHWS) |
|
|
| Duration |
January 13 – January 20 |
| Peak intensity |
150 km/h (90 mph) (10-min) 955 hPa (mbar) |
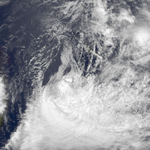
On January 13, TCWC Nadi started to monitor a shallow depression that had developed within the monsoon trough about 725 km (450 mi) to the west of Espiritu Santo, Vanuatu.[1] Over the next day the system moved eastwards and developed further as gale-force winds developed near the systems centre before the JTWC initiated advisories on the system and designated it as Tropical Cyclone 11P during January 14.[1][2] The system was subsequently named Eric by TCWC Nadi as it moved closer to Espiritu Santo and became equivalent to a category 1 tropical cyclone.[1][3] During January 15, Eric passed near or over Espiritu Santo, as it continued to intensify before it turned and accelerated south-eastwards.[1] Eric subsequently became equivalent to a category 3 severe tropical cyclone early the next day, before an Air Pacific flight from Fiji to the Solomon Islands located the systems eye on radar.[1]
During January 17, Eric's well defined eye came into the range of Nadi airports surveillance radar, before TCWC Nadi estimated that Eric had peaked with 10-minute sustained wind-speeds of 150 km/h (90 mph).[1][3] During that day Eric's eye seemed to contract to around 15 km (10 mi) as it made passed through Fiji's Western Division and made landfall on the Fijian main island of Viti Levu about 10 km (5 mi) to the south of Nadi.[1] After the system had made landfall, the JTWC estimated that Eric had peaked with 1-minute sustained wind speeds of 185 km/h (115 mph), which made it equivalent to a category 3 hurricane on the SSHWS.[4] The system subsequently passed near or over Fiji's capital: Suva before emerging into the Korro Sea and weakening. Eric subsequently passed through the Tonga's Ha'apai islands just to the south of Nomuka during January 18, before it gradually weakened and was last noted during January 20, over 1,800 km (1,120 mi) to the south of Papete, French Polynesia.[3][4]
Severe Tropical Cyclone Nigel
| Category 3 severe tropical cyclone (Australian scale) |
| Category 3 tropical cyclone (SSHWS) |
|
|
| Duration |
January 16 – January 28 |
| Peak intensity |
150 km/h (90 mph) (10-min) 955 hPa (mbar) |
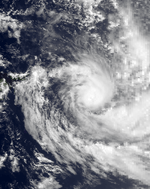
Late on January 16, Tropical Cyclone Nigel moved into the South Pacific basin from the Australian region. During the next day the system continued to move eastwards and developed an eye, before it became equivalent to a modern-day category 3 severe tropical cyclone.
Severe Tropical Cyclone Odette
| Category 3 severe tropical cyclone (Australian scale) |
| Category 2 tropical cyclone (SSHWS) |
|
|
| Duration |
January 19 – January 21 |
| Peak intensity |
140 km/h (85 mph) (10-min) 960 hPa (mbar) |
At around 1300 UTC on January 19, Severe Tropical Cyclone Odette moved into the South Pacific Basin from the Australian Region
Severe Tropical Cyclone Freda
| Category 3 severe tropical cyclone (Australian scale) |
| Category 1 tropical cyclone (SSHWS) |
|
|
| Duration |
January 25 – January 30 |
| Peak intensity |
150 km/h (90 mph) (10-min) 955 hPa (mbar) |
Severe Tropical Cyclone Freda existed from January 26 to January 30.
Tropical Cyclone Gavin
| Category 2 tropical cyclone (Australian scale) |
| Tropical storm (SSHWS) |
|
|
| Duration |
March 2 – March 9 |
| Peak intensity |
95 km/h (60 mph) (10-min) 985 hPa (mbar) |
Gavin caused widespread flooding within the western division of Fiji, with seven people killed as a result.[5]
Severe Tropical Cyclone Hina
| Category 5 severe tropical cyclone (Australian scale) |
| Category 4 tropical cyclone (SSHWS) |
|
|
| Duration |
March 11 – March 20 |
| Peak intensity |
220 km/h (140 mph) (10-min) 910 hPa (mbar) |
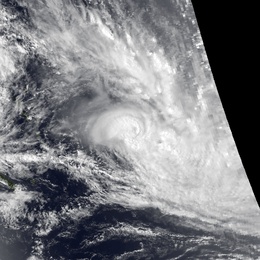
One of the most intense tropical cyclones in the basin.
Season effects
This table lists all the storms that developed in the South Pacific basin during the 1984–85 season. It includes their intensity on the Australian Tropical cyclone intensity scale, duration, name, areas affected, deaths, and damages. For most storms the data is taken from RSMC Nadi's and or TCWC Wellington's archives, however data for 03P has been taken from the JTWC/NPMOC archives as opposed to RSMC Nadi's or TCWC Wellington's, and thus the winds are over 1-minute as opposed to 10-minutes.
References
External links
