Amber Valley Borough Council election, 2006
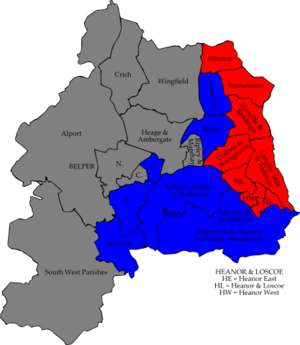
Map of the results of the 2006 Amber Valley council election. Labour in red and Conservatives in blue. Wards in grey were not contested in 2006.
Elections to Amber Valley Borough Council were held on 4 May 2006. One third of the council was up for election and the Conservative party held overall control of the council. Overall turnout was 34%.
After the election, the composition of the council was
- Conservative 27
- Labour 18
Election result
| Amber Valley Local Election Result 2006 | ||||||||||
|---|---|---|---|---|---|---|---|---|---|---|
| Party | Seats | Gains | Losses | Net gain/loss | Seats % | Votes % | Votes | +/− | ||
| Labour | 8 | 0 | 3 | -3 | 53.3 | 39.4 | 9,361 | -3.6% | ||
| Conservative | 7 | 3 | 0 | +3 | 46.7 | 43.2 | 10,259 | +0.0% | ||
| Liberal | 0 | 0 | 0 | 0 | 0 | 11.6 | 2,758 | +1.8% | ||
| BNP | 0 | 0 | 0 | 0 | 0 | 4.7 | 1,116 | +2.0% | ||
| Green | 0 | 0 | 0 | 0 | 0 | 1.1 | 252 | +1.1% | ||
Ward results
| Party | Candidate | Votes | % | ± | |
|---|---|---|---|---|---|
| Labour | John Walker | 1,044 | 55.8 | +8.5 | |
| Conservative | David Wilson | 564 | 30.1 | +1.0 | |
| Liberal | Paul Gibbons | 264 | 14.1 | -9.5 | |
| Majority | 480 | 25.7 | +7.5 | ||
| Turnout | 1,872 | 30 | -11 | ||
| Labour hold | Swing | ||||
| Party | Candidate | Votes | % | ± | |
|---|---|---|---|---|---|
| Conservative | Martin Tomlinson | 699 | 50.9 | +1.8 | |
| Labour | Randall Sanders | 395 | 28.8 | -7.7 | |
| Liberal | Hassan Dervish | 278 | 20.3 | +5.9 | |
| Majority | 304 | 22.1 | +9.5 | ||
| Turnout | 1,372 | 31 | |||
| Conservative hold | Swing | ||||
| Party | Candidate | Votes | % | ± | |
|---|---|---|---|---|---|
| Conservative | James Anderson | 529 | 43.3 | -13.0 | |
| Labour | Peter Shepherd | 398 | 32.5 | -11.2 | |
| Green | Colin Grimley | 163 | 13.3 | +13.3 | |
| Liberal | Timothy Clark | 133 | 10.9 | +10.9 | |
| Majority | 131 | 10.8 | -1.8 | ||
| Turnout | 1,223 | 32 | |||
| Conservative hold | Swing | ||||
| Party | Candidate | Votes | % | ± | |
|---|---|---|---|---|---|
| Labour | Ian Fisher | 676 | 52.7 | -5.9 | |
| Conservative | Roy Wildsmith | 424 | 33.0 | -8.4 | |
| Liberal | Colin Murfin | 183 | 14.3 | +14.3 | |
| Majority | 252 | 19.7 | +2.5 | ||
| Turnout | 1,283 | 33 | -12 | ||
| Labour hold | Swing | ||||
| Party | Candidate | Votes | % | ± | |
|---|---|---|---|---|---|
| Conservative | Christopher Short | 982 | 64.9 | +7.6 | |
| Liberal | Colin Thompson | 238 | 15.7 | -5.6 | |
| Labour | Diana Hancock | 203 | 13.4 | -8.0 | |
| Green | Karen How | 89 | 5.9 | +5.9 | |
| Majority | 744 | 49.2 | +13.3 | ||
| Turnout | 1,512 | 43 | -6 | ||
| Conservative hold | Swing | ||||
| Party | Candidate | Votes | % | ± | |
|---|---|---|---|---|---|
| Labour | John Moon | 731 | 43.4 | -10.5 | |
| BNP | Paul Snell | 524 | 31.1 | +31.1 | |
| Conservative | Jean Parry | 327 | 19.4 | -26.7 | |
| Liberal | Sally Mcintosh | 103 | 6.1 | +6.1 | |
| Majority | 207 | 12.3 | +4.5 | ||
| Turnout | 1,685 | 41 | -1 | ||
| Labour hold | Swing | ||||
| Party | Candidate | Votes | % | ± | |
|---|---|---|---|---|---|
| Labour | Glynne Cato | 567 | 44.4 | -20.5 | |
| Conservative | Linda Edwards-Milsom | 468 | 36.6 | +1.5 | |
| Liberal | Gavin Sarkas-Bosman | 242 | 19.0 | +19.0 | |
| Majority | 99 | 7.8 | -22.0 | ||
| Turnout | 1,277 | 29 | -12 | ||
| Labour hold | Swing | ||||
| Party | Candidate | Votes | % | ± | |
|---|---|---|---|---|---|
| Labour | Paul Jones | 607 | 32.0 | -2.7 | |
| BNP | Brian Edwards | 592 | 31.2 | +5.0 | |
| Liberal | Judith Woolley | 427 | 22.5 | +6.2 | |
| Conservative | Jade Wiltshire | 273 | 14.4 | -8.5 | |
| Majority | 15 | 0.8 | -7.7 | ||
| Turnout | 1,899 | 42 | -3 | ||
| Labour hold | Swing | ||||
| Party | Candidate | Votes | % | ± | |
|---|---|---|---|---|---|
| Labour | Paul Smith | 700 | 45.0 | +0.8 | |
| Conservative | Patricia Bomar | 660 | 42.5 | -13.3 | |
| Liberal | Gordon Monaghan | 194 | 12.5 | +12.5 | |
| Majority | 40 | 2.5 | |||
| Turnout | 1,554 | 34 | -8 | ||
| Labour hold | Swing | ||||
| Party | Candidate | Votes | % | ± | |
|---|---|---|---|---|---|
| Conservative | Jean Gemmell | 1,396 | 63.3 | +16.0 | |
| Labour | John Grace | 811 | 36.7 | +3.2 | |
| Majority | 585 | 26.6 | +12.8 | ||
| Turnout | 2,207 | 36 | -11 | ||
| Conservative gain from Labour | Swing | ||||
| Party | Candidate | Votes | % | ± | |
|---|---|---|---|---|---|
| Labour | Stephanie Ward | 472 | 48.7 | -5.8 | |
| Conservative | Terence Thorpe | 343 | 35.4 | +16.9 | |
| Liberal | Keith Falconbridge | 154 | 15.9 | +6.9 | |
| Majority | 129 | 13.3 | -22.7 | ||
| Turnout | 969 | 25 | -15 | ||
| Labour hold | Swing | ||||
| Party | Candidate | Votes | % | ± | |
|---|---|---|---|---|---|
| Conservative | Elizabeth Bowley | 1,042 | 48.3 | -0.8 | |
| Labour | Charles Cutting | 794 | 36.8 | +4.9 | |
| Liberal | Catharine Smith | 322 | 14.9 | -4.1 | |
| Majority | 248 | 11.5 | -5.7 | ||
| Turnout | 2,158 | 32 | -9 | ||
| Conservative gain from Labour | Swing | ||||
| Party | Candidate | Votes | % | ± | |
|---|---|---|---|---|---|
| Conservative | Kevin Parkinson | 1,115 | 58.5 | +0.0 | |
| Labour | Eric Lancashire | 790 | 41.5 | +0.0 | |
| Majority | 325 | 17.0 | +0.0 | ||
| Turnout | 1,905 | 42 | -8 | ||
| Conservative gain from Labour | Swing | ||||
| Party | Candidate | Votes | % | ± | |
|---|---|---|---|---|---|
| Labour | Brian Lyttle | 784 | 63.3 | +8.1 | |
| Conservative | Sally West | 454 | 36.7 | +9.5 | |
| Majority | 330 | 26.6 | -1.4 | ||
| Turnout | 1,238 | 28 | -10 | ||
| Labour hold | Swing | ||||
| Party | Candidate | Votes | % | ± | |
|---|---|---|---|---|---|
| Conservative | Allen King | 983 | 61.7 | +5.8 | |
| Labour | Michael Missett | 389 | 24.4 | -7.0 | |
| Liberal | Paulette Robinson | 220 | 13.8 | +13.8 | |
| Majority | 594 | 37.3 | +12.8 | ||
| Turnout | 1,592 | 37 | |||
| Conservative hold | Swing | ||||
External links
BBC report of 2006 Amber Valley election result
| Derbyshire County Council | |
|---|---|
| Amber Valley Borough Council | |
| Bolsover District Council | |
| Chesterfield Borough Council |
|
| Derby City Council | |
| Derbyshire Dales District Council | |
| Erewash Borough Council | |
| High Peak Borough Council | |
| North East Derbyshire District Council |
|
| South Derbyshire District Council |
|
| |
This article is issued from Wikipedia - version of the 12/4/2015. The text is available under the Creative Commons Attribution/Share Alike but additional terms may apply for the media files.