United States House of Representatives elections in California, 1876
| | |||||||||||||||||||||||||||||||||||
| |||||||||||||||||||||||||||||||||||
| |||||||||||||||||||||||||||||||||||
|
| |||||||||||||||||||||||||||||||||||
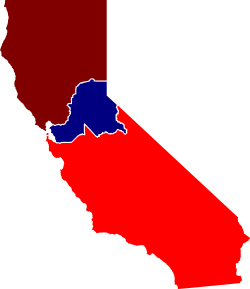
| Election results by district. | |||||||||||||||||||||||||||||||||||
| Elections in California | ||||||||||
|---|---|---|---|---|---|---|---|---|---|---|
 | ||||||||||
|
||||||||||
|
||||||||||
The United States House of Representatives elections in California, 1876 was an election for California's delegation to the United States House of Representatives, which occurred as part of the general election of the House of Representatives on November 7, 1876. Republicans gained two districts.
Overview
| United States House of Representatives elections in California, 1876 | |||||
|---|---|---|---|---|---|
| Party | Votes | Percentage | Seats | +/– | |
| Republican | 81,043 | 52.2% | 3 | +2 | |
| Democratic | 74,228 | 47.8% | 1 | -2 | |
| Totals | 155,271 | 100.0% | 4 | — | |
Delegation Composition
| Pre-election | Seats | |
| Democratic-Held | 3 | |
| Republican-Held | 1 | |
| Post-election | Seats | |
| Republican-Held | 3 | |
| Democratic-Held | 1 | |
Results
Final results from the Clerk of the House of Representatives:
District 1
| Party | Candidate | Votes | % | |||
|---|---|---|---|---|---|---|
| Republican | Horace Davis | 22,134 | 53.3 | |||
| Democratic | William Adam Piper (incumbent) | 19,363 | 46.7 | |||
| Total votes | 41,497 | 100.0 | ||||
| Voter turnout | % | |||||
| Republican gain from Democratic | ||||||
District 2
Template:Election box very minor change.
| Party | Candidate | Votes | % | |
|---|---|---|---|---|
| Republican | Horace F. Page (incumbent) | 20,815 | 56.7 | |
| Democratic | G. J. Carpenter | 15,916 | 43.3 | |
| Voter turnout | % | |||
| Republican hold | ||||
District 3
| Party | Candidate | Votes | % | |
|---|---|---|---|---|
| Democratic | John K. Luttrell (incumbent) | 19,846 | 51.1 | |
| Republican | Joseph McKenna | 18,990 | 48.9 | |
| Total votes | 38,836 | 100.0 | ||
| Voter turnout | % | |||
| Democratic hold | ||||
District 4
| Party | Candidate | Votes | % | |||
|---|---|---|---|---|---|---|
| Republican | Romualdo Pacheco | 19,104 | 50.0 | |||
| Democratic | Peter D. Wigginton (incumbent) | 19,103 | 50.0 | |||
| Total votes | 38,207 | 100.0 | ||||
| Voter turnout | % | |||||
| Republican gain from Democratic | ||||||
See also
- 45th United States Congress
- Political party strength in California
- Political party strength in U.S. states
- United States House of Representatives elections, 1876
References
External links
- California Legislative District Maps (1911-Present)
- RAND California Election Returns: District Definitions
This article is issued from Wikipedia - version of the 12/1/2014. The text is available under the Creative Commons Attribution/Share Alike but additional terms may apply for the media files.
