United States House of Representatives elections in California, 1896
| | |||||||||||||||||||||||||||||||||||||||||||
| |||||||||||||||||||||||||||||||||||||||||||
| |||||||||||||||||||||||||||||||||||||||||||
|
| |||||||||||||||||||||||||||||||||||||||||||
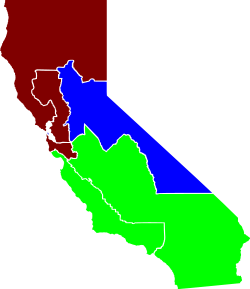
| Election results by district. | |||||||||||||||||||||||||||||||||||||||||||
| Elections in California | ||||||||||
|---|---|---|---|---|---|---|---|---|---|---|
 | ||||||||||
|
||||||||||
|
||||||||||
The United States House of Representatives elections in California, 1896 was an election for California's delegation to the United States House of Representatives, which occurred as part of the general election of the House of Representatives on November 3, 1896. Republicans lost one seat to the Democrats and two to the Populists.
Overview
| United States House of Representatives elections in California, 1896 | |||||
|---|---|---|---|---|---|
| Party | Votes | Percentage | Seats | +/– | |
| Republican | 128,941 | 46.4% | 3 | -3 | |
| Democratic | 86,449 | 31.1% | 2 | +1 | |
| Populist | 53,662 | 19.3% | 2 | +2 | |
| Prohibition | 4,251 | 1.5% | 0 | 0 | |
| Socialist Labor | 2,654 | 1.0% | 0 | 0 | |
| Independent | 2,139 | 0.8% | 0 | 0 | |
| Totals | 278,096 | 100.0% | 7 | — | |
Delegation Composition
| Pre-election | Seats | |
| Republican-Held | 6 | |
| Democratic-Held | 1 | |
| Post-election | Seats | |
| Republican-Held | 3 | |
| Democratic-Held | 2 | |
| Populist-Held | 2 | |
Results
District 1
| Party | Candidate | Votes | % | |
|---|---|---|---|---|
| Republican | John All Barham (incumbent) | 17,826 | 49.7 | |
| Democratic | Fletcher A. Cutler | 16,328 | 45.5 | |
| Populist | George W. Montieth | 1,497 | 4.2 | |
| Prohibition | B. F. Taylor | 249 | 0.7 | |
| Total votes | 35,900 | 100.0 | ||
| Voter turnout | % | |||
| Republican hold | ||||
District 2
| Party | Candidate | Votes | % | |||
|---|---|---|---|---|---|---|
| Democratic | Marion De Vries | 24,434 | 55.5 | |||
| Republican | Grove L. Johnson (incumbent) | 18,613 | 42.3 | |||
| Prohibition | F. E. Coulter | 974 | 2.2 | |||
| Total votes | 44,021 | 100.0 | ||||
| Voter turnout | % | |||||
| Democratic gain from Republican | ||||||
District 3
| Party | Candidate | Votes | % | |
|---|---|---|---|---|
| Republican | Samuel G. Hilborn (incumbent) | 19,778 | 54.0 | |
| Democratic | Warren B. English | 16,119 | 44.0 | |
| Socialist Labor | John H. Eustice | 387 | 1.1 | |
| Prohibition | W. Shafer | 327 | 0.9 | |
| Total votes | 36,611 | 100.0 | ||
| Voter turnout | % | |||
| Republican hold | ||||
District 4
| Party | Candidate | Votes | % | |
|---|---|---|---|---|
| Democratic | James G. Maguire (incumbent) | 19,074 | 61.0 | |
| Republican | Thomas B. O'Brien | 10,940 | 35.0 | |
| Socialist Labor | E. T. Kingsley | 968 | 3.0 | |
| Prohibition | Joseph Rowell | 299 | 1.0 | |
| Total votes | 31,281 | 100.0 | ||
| Voter turnout | % | |||
| Democratic hold | ||||
District 5
| Party | Candidate | Votes | % | |
|---|---|---|---|---|
| Republican | Eugene F. Loud (incumbent) | 19,351 | 48.6 | |
| Democratic | Joseph P. Kelly | 10,494 | 26.3 | |
| Populist | A. B. Kinne | 8,825 | 22.2 | |
| Socialist Labor | Henry Daniels | 757 | 1.9 | |
| Prohibition | T. H. Lawson | 404 | 1.0 | |
| Total votes | 39,831 | 100.0 | ||
| Voter turnout | % | |||
| Republican hold | ||||
District 6
| Party | Candidate | Votes | % | |||
|---|---|---|---|---|---|---|
| Populist | Charles A. Barlow | 24,157 | 48.9 | |||
| Republican | James McLachlan (incumbent) | 23,494 | 47.6 | |||
| Prohibition | Henry Clay Needham | 1,196 | 2.4 | |||
| Socialist Labor | Job Harriman | 542 | 1.1 | |||
| Total votes | 49,389 | 100.0 | ||||
| Voter turnout | % | |||||
| Populist gain from Republican | ||||||
District 7
| Party | Candidate | Votes | % | |||
|---|---|---|---|---|---|---|
| Populist | Curtis H. Castle | 19,183 | 46.7 | |||
| Republican | William W. Bowers (incumbent) | 18,939 | 46.1 | |||
| Independent | William H. "Billy" Carlson | 2,139 | 5.2 | |||
| Prohibition | James W. Webb | 802 | 2.0 | |||
| Total votes | 41,063 | 100.0 | ||||
| Voter turnout | % | |||||
| Populist gain from Republican | ||||||
See also
- 55th United States Congress
- Political party strength in California
- Political party strength in U.S. states
- United States House of Representatives elections, 1896
References
External links
- California Legislative District Maps (1911-Present)
- RAND California Election Returns: District Definitions
This article is issued from Wikipedia - version of the 9/10/2016. The text is available under the Creative Commons Attribution/Share Alike but additional terms may apply for the media files.
